

CLICK ON THE IMAGERIES BELOW TO GET THEM ENLARGED


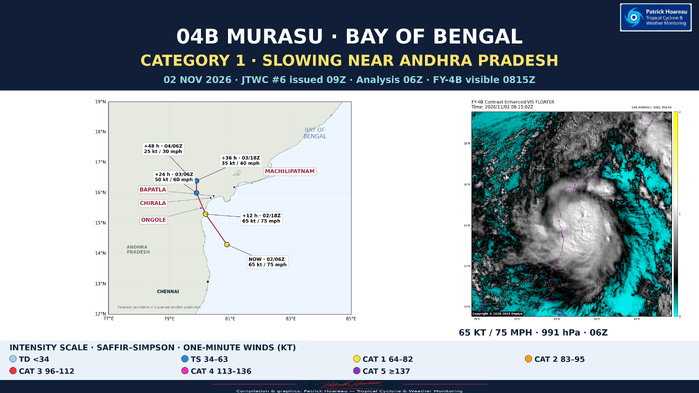
02 NOVEMBER 2026 • 0900 UTC
TROPICAL CYCLONE 04B (MURASU) — CATEGORY 1
Slowing near Andhra Pradesh; a delayed SAR pass adds an important intensity clue
Based on JTWC warning #06, issued at 0900 UTC on 2 November 2026. The official initial analysis is valid at 0600 UTC. This focus also includes the supplied satellite imagery and two RCM-3 SAR acquisitions, including an earlier pass processed with a substantial delay.
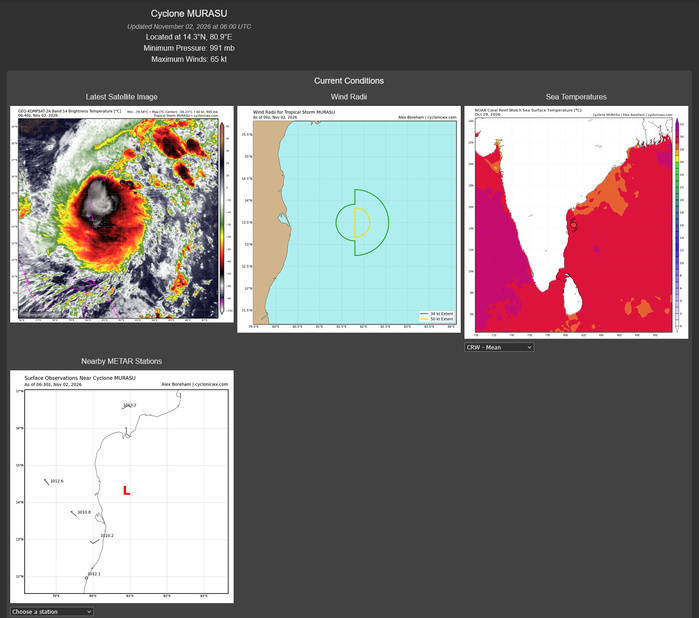
CURRENT ANALYSIS — 02 NOVEMBER, 0600 UTC
Centre: 14.3°N, 80.9°E, approximately 656 nautical miles southwest of Kolkata.
Maximum sustained wind: 65 kt / 75 mph / approximately 120 km/h, averaged over one minute; Category 1 on the Saffir–Simpson wind scale. Gusts: 80 kt / approximately 150 km/h.
Minimum central pressure: 991 hPa.
Movement over the preceding six hours: northwestward, 305°, at 7 kt / approximately 13 km/h.
Significant wave height: 24 ft / approximately 7.3 m. This describes significant wave height, not storm surge or the maximum individual wave.
The bulletin's extrapolated 0900 UTC position is 14.6°N, 80.7°E; it is distinct from the 0600 UTC analysis position.
SATELLITE STRUCTURE AND POSITION UNCERTAINTY
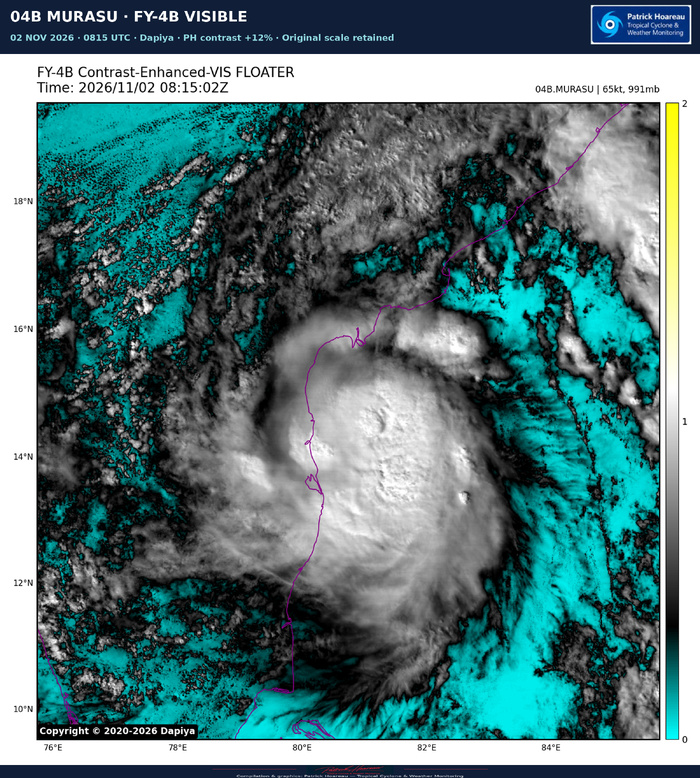
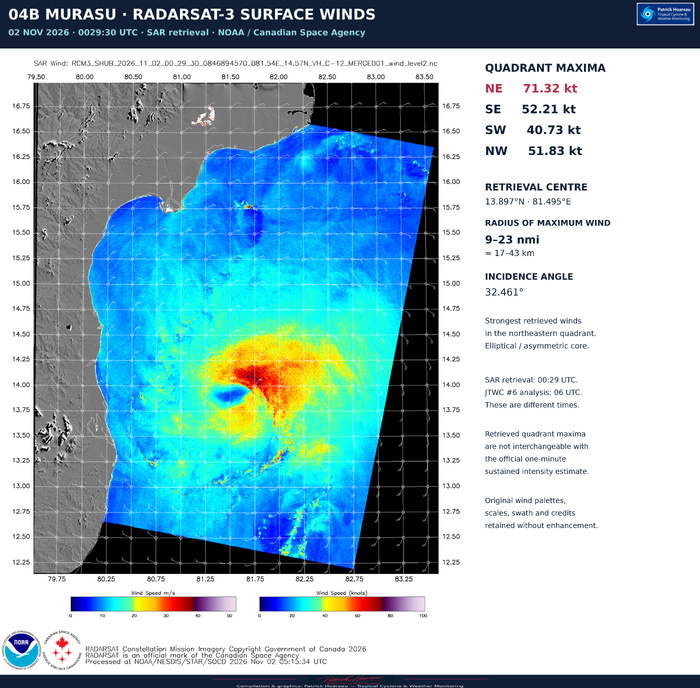
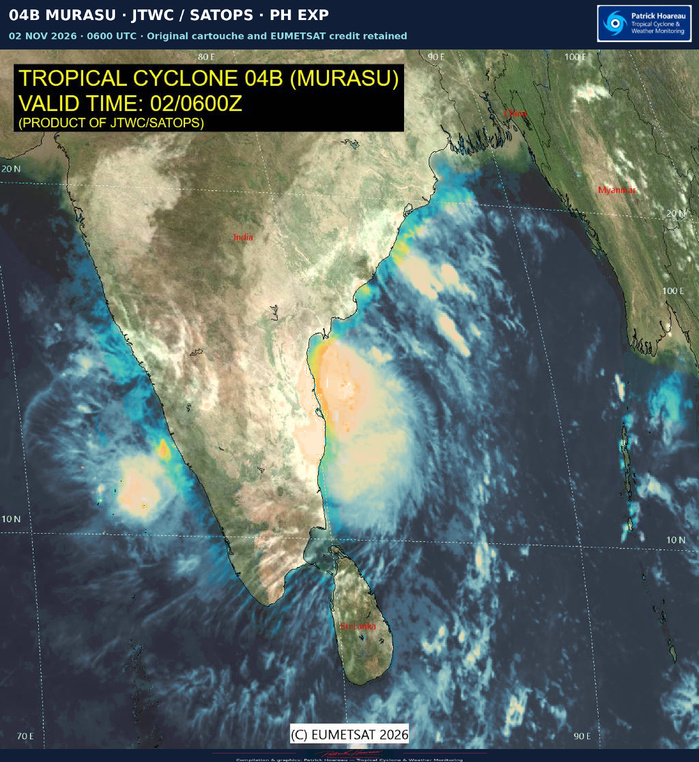
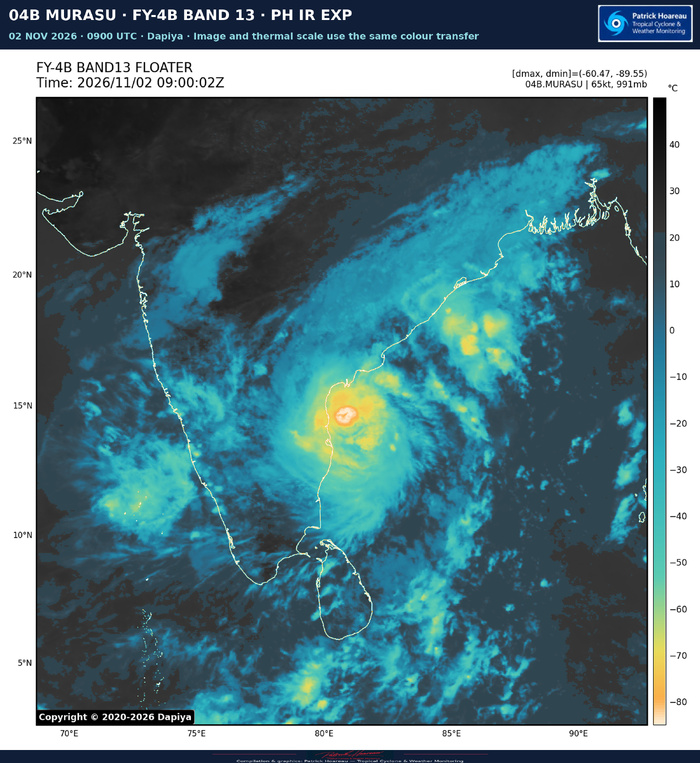
JTWC describes a compact vortex with deep inner-core convection and vigorous overshooting cloud tops over and around the assessed low-level centre. The 0029 UTC SAR pass showed an elliptical, asymmetric circulation, enclosed by gale-force winds, with the strongest winds in the northeastern quadrant. It supported a high-confidence post-analysis position at 0000 UTC and a broader wind field than previously estimated.
Confidence in the later 0600 UTC centre is nevertheless LOW: subsequent microwave and scatterometer coverage was insufficient, and even the coastal IMD Doppler radar reflectivity did not resolve a discrete low-level centre. The warning specifies a position accuracy of 60 nautical miles. Initial intensity confidence is MEDIUM; wind-radii confidence is HIGH.
The accompanying imagery comprises the JTWC/SATOPS 0600 UTC image, FY-4B contrast-enhanced visible imagery at 0815:02 UTC, and FY-4B Band 13 infrared imagery at 0900:02 UTC. The visual enhancements improve presentation; they do not constitute a new intensity estimate. Source times, credits and scales are retained.
STEERING AND LANDFALL OUTLOOK
MURASU has slowed abruptly as the subtropical ridge splits into two anticyclonic cells, creating a weak-steering col. JTWC expects a more north-northwestward motion during the next 12–18 hours, with very slow movement and a possible brief stall immediately offshore.
Landfall along the Andhra Pradesh coast is forecast near forecast hour 12 — approximately 1800 UTC on 2 November, or 2330 IST. This timing is not fixed: additional slowing or a stronger northward turn could delay landfall and shift it farther north along the coast. The official forecast position at that time is 15.3°N, 80.2°E.
After landfall, the weakening circulation should move slowly northward before turning westward as it becomes shallower and decouples from the flow aloft. JTWC forecasts dissipation as a significant tropical cyclone over eastern India by 48 hours.
OFFICIAL JTWC FORECAST #06
Winds are maximum sustained one-minute winds; forecast hours are measured from 02 November 0600 UTC.
Hour | Valid time (UTC) | Position | Wind | Gust
0 | 02 Nov 0600 | 14.3°N 80.9°E | 65 kt | 80 kt
12 | 02 Nov 1800 | 15.3°N 80.2°E | 65 kt | 80 kt
24 | 03 Nov 0600 | 16.0°N 79.9°E | 50 kt | 65 kt
36 | 03 Nov 1800 | 16.4°N 79.9°E | 35 kt | 45 kt — dissipating inland
48 | 04 Nov 0600 | 16.6°N 79.6°E | 25 kt | 35 kt — dissipated as a significant tropical cyclone inland
WHY FURTHER INTENSIFICATION IS UNLIKELY IN THIS FORECAST
The large-scale environment remains marginally favourable: sea-surface temperatures of 30–31°C, deep-layer vertical wind shear of 5–10 kt, and strong poleward and equatorward outflow. These benefits are tempered by northwesterly mid-level shear and increasing land interaction.
JTWC expects dry continental air to enter the western inner core at low levels. Slow movement over shallow coastal waters may also promote local upwelling and reduce the oceanic heat supply. Friction and terrain should then drive rapid weakening after landfall.
MODEL GUIDANCE AND CONFIDENCE
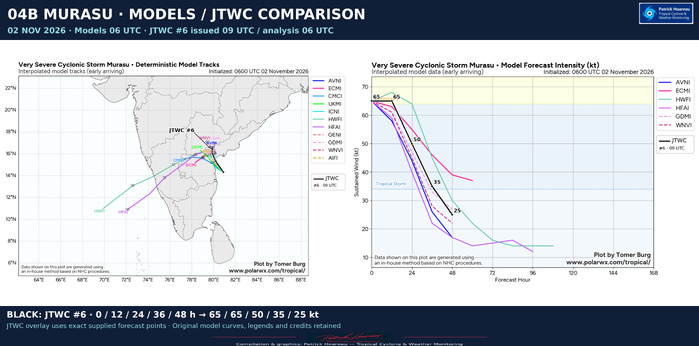
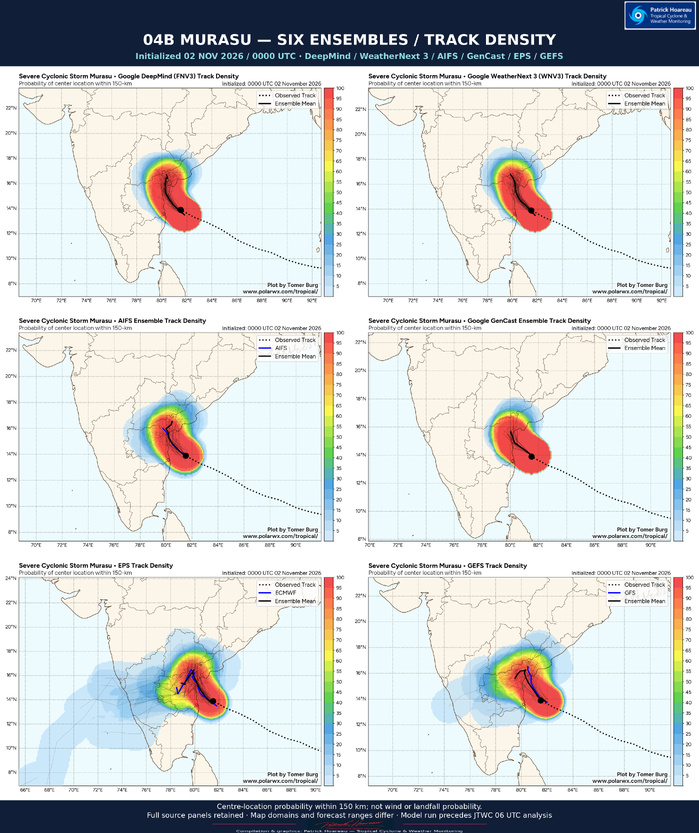
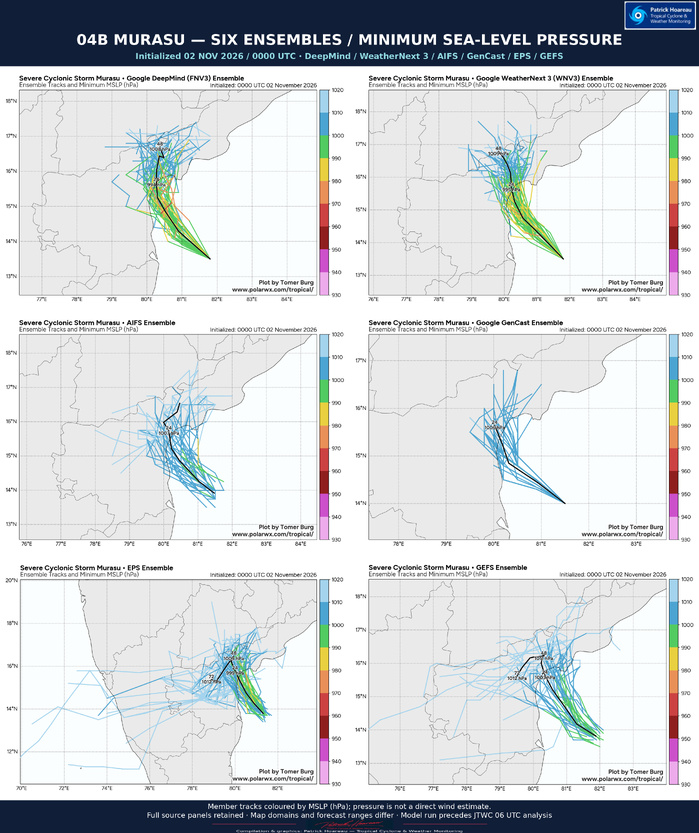
JTWC reports broad track agreement, but many models do not resolve the subtle northward deflection. GFS, Google DeepMind, HAFS-A and HWRF capture that turn; the official forecast follows GFS and HAFS-A most closely. Track confidence is MEDIUM.
Most intensity guidance weakens MURASU immediately; SHIPS-GFS is the exception, showing modest strengthening before landfall. JTWC places its forecast 5 kt above the ICNW intensity consensus throughout the forecast period, with HIGH intensity-forecast confidence. The accompanying model comparison includes the official JTWC track and intensity forecast on both panels.
INTENSITY ESTIMATES AND THE 0530 UTC SATELLITE FIX
Estimates listed in the JTWC reasoning:
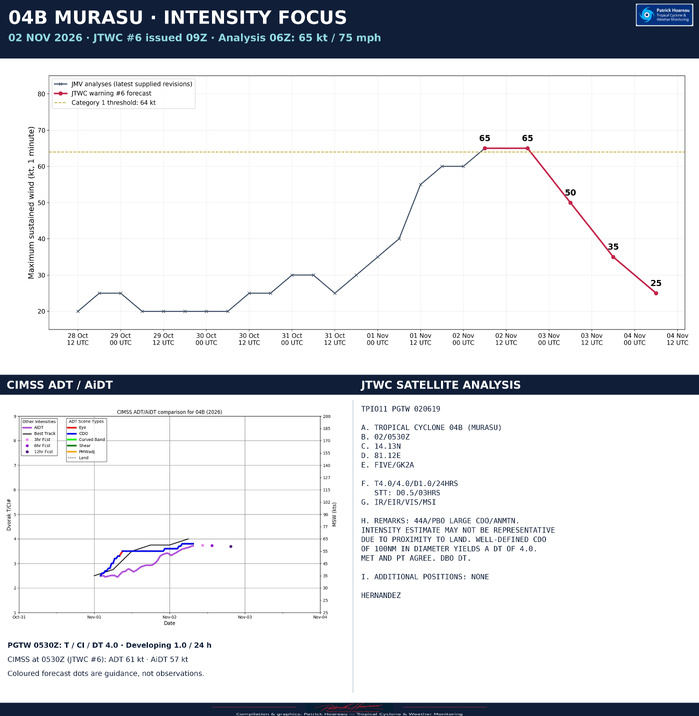
PGTW: T4.0 / 65 kt.
DEMS: T3.5 / 55 kt.
CIMSS ADT: 61 kt at 0530 UTC.
CIMSS AiDT: 57 kt at 0530 UTC.
CIMSS D-MINT: 54 kt at 0023 UTC.
CIMSS D-PRINT: 66 kt at 0530 UTC.
The PGTW fix at 0530 UTC places the centre at 14.13°N, 81.12°E using GK2A imagery. Its classification is T4.0/4.0, developing by 1.0 T-number over 24 hours, with a short-term increase of 0.5 over three hours. A well-defined central dense overcast approximately 100 nautical miles in diameter yields DT 4.0; MET and PT agree, and DT is the selected basis. That diameter describes the CDO, not an eye.
The fix explicitly warns that the intensity estimate may not be representative because of proximity to land. The accompanying CIMSS chart's 3-, 6- and 12-hour forecast dots are forecasts, not subsequent observations.
TWO SAR PASSES — A MATERIAL ADDITION TO THE INTENSITY REVIEW
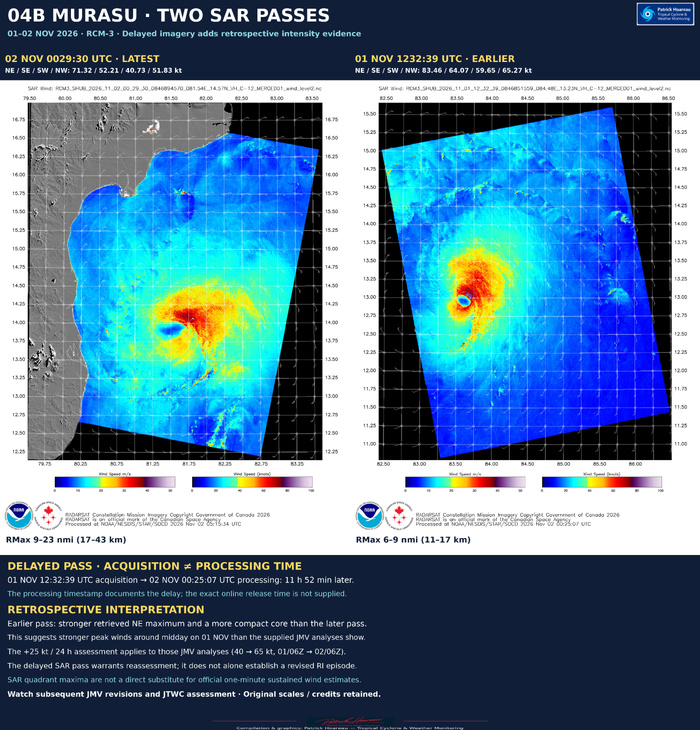
Earlier acquisition: 01 November 1232:39 UTC, RCM-3.
Retrieved centre: 12.953°N, 83.601°E.
Quadrant maximum retrieved winds: NE 83.46 kt; SE 64.07 kt; SW 59.65 kt; NW 65.27 kt.
Reported RMax range: 6–9 nautical miles, approximately 11–17 km.
NOAA processing timestamp: 02 November 0025:07 UTC, 11 hours 52 minutes 28 seconds after acquisition. The exact online publication time is not provided by these files.
Later acquisition: 02 November 0029:30 UTC, RCM-3.
Retrieved centre: 13.897°N, 81.495°E.
Quadrant maximum retrieved winds: NE 71.32 kt; SE 52.21 kt; SW 40.73 kt; NW 51.83 kt.
Reported RMax range: 9–23 nautical miles, approximately 17–43 km.
NOAA processing timestamp: 02 November 0515:34 UTC.
The earlier pass reveals a more compact core and a higher northeastern wind maximum than the later pass. Its 83.46 kt retrieval is also substantially above the supplied revised JMV analysis of 55 kt at 1200 UTC on 1 November. This is an important reason to revisit the intensity peak and the subsequent evolution when further JMV/JTWC revisions become available.
SAR quadrant maxima are retrievals at the acquisition time; they cannot simply replace an official one-minute sustained intensity. The two passes alone do not determine a revised 24-hour intensity change. The comparison retains each source's full wind palette, scales and credits, with the later pass on the left and the earlier pass on the right.
RAPID INTENSIFICATION — CURRENT JMV RECORD AND RIPA CONTEXT
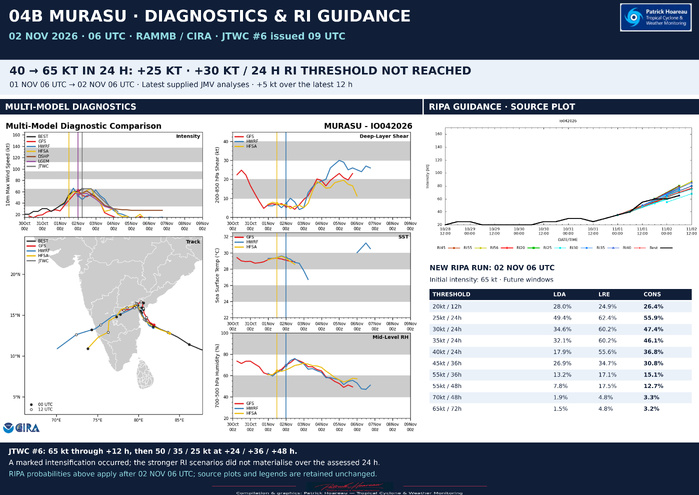
In the supplied revised JMV sequence, the intensity increases from 40 kt at 0600 UTC on 1 November to 65 kt at 0600 UTC on 2 November: +25 kt in 24 hours. That sequence does not meet the +30 kt/24-hour threshold used in this comparison. It also gives only +5 kt in the latest 12 hours, from 60 to 65 kt.
The much stronger intensification suggested by earlier RIPA guidance did not appear in that supplied JMV record. However, the delayed 1 November SAR pass raises a material question about the analysed peak. The RI assessment should therefore be revisited against any subsequent JMV/JTWC intensity revisions, rather than treating the present JMV sequence as a final post-season analysis.
For reference, the RIPA consensus probabilities in the 02 November 0600 UTC table are:
Gain / interval | Probability
20 kt / 12 h | 26.4%
25 kt / 24 h | 55.9%
30 kt / 24 h | 47.4%
35 kt / 24 h | 46.1%
40 kt / 24 h | 36.8%
45 kt / 36 h | 30.8%
55 kt / 36 h | 15.1%
55 kt / 48 h | 12.7%
70 kt / 48 h | 3.3%
65 kt / 72 h | 3.2%
These probabilities belong to the 0600 UTC run and apply forward from that run; they are not a verification of earlier runs. The separate RIPA shear diagnostics should not be equated directly with JTWC's assessed deep-layer shear, and its 2.6 km core predictor should not be labelled an eye diameter or a measured radius of maximum wind.
OFFICIAL WIND RADII
Radii in nautical miles, ordered NE / SE / SW / NW. Valid over open water only. A zero is the value in the warning, not a statement that no winds occur in that quadrant.
02 Nov 0600 UTC: 64 kt 25/25/0/0; 50 kt 50/40/0/20; 34 kt 80/70/55/50.
02 Nov 1800 UTC: 64 kt 20/20/0/0; 50 kt 40/30/0/20; 34 kt 70/70/50/50.
03 Nov 0600 UTC: 50 kt 20/20/0/0; 34 kt 50/50/30/30.
The main forecast issue is the slowing approach to the coast and the possible delay or northward shift of landfall. The main analysis issue is the earlier intensity peak highlighted by the delayed SAR pass. Forecast and analysis times must remain distinct throughout the comparison.
Sources: supplied JTWC warning #06 and prognostic reasoning; PGTW satellite fix; CIMSS ADT/AiDT chart; RAMMB/CIRA diagnostics and RIPA table; NOAA/NESDIS/STAR RCM-3 SAR images and information summaries; JTWC/SATOPS and Dapiya/FY-4B imagery. This text reflects those supplied products, not a subsequent bulletin update.
Compilation & analysis: Patrick Hoareau — Tropical Cyclone & Weather Monitoring
TROPICAL CYCLONE 04B (MURASU) — CATEGORY 1
Slowing near Andhra Pradesh; a delayed SAR pass adds an important intensity clue
Based on JTWC warning #06, issued at 0900 UTC on 2 November 2026. The official initial analysis is valid at 0600 UTC. This focus also includes the supplied satellite imagery and two RCM-3 SAR acquisitions, including an earlier pass processed with a substantial delay.
CURRENT ANALYSIS — 02 NOVEMBER, 0600 UTC
Centre: 14.3°N, 80.9°E, approximately 656 nautical miles southwest of Kolkata.
Maximum sustained wind: 65 kt / 75 mph / approximately 120 km/h, averaged over one minute; Category 1 on the Saffir–Simpson wind scale. Gusts: 80 kt / approximately 150 km/h.
Minimum central pressure: 991 hPa.
Movement over the preceding six hours: northwestward, 305°, at 7 kt / approximately 13 km/h.
Significant wave height: 24 ft / approximately 7.3 m. This describes significant wave height, not storm surge or the maximum individual wave.
The bulletin's extrapolated 0900 UTC position is 14.6°N, 80.7°E; it is distinct from the 0600 UTC analysis position.
SATELLITE STRUCTURE AND POSITION UNCERTAINTY
JTWC describes a compact vortex with deep inner-core convection and vigorous overshooting cloud tops over and around the assessed low-level centre. The 0029 UTC SAR pass showed an elliptical, asymmetric circulation, enclosed by gale-force winds, with the strongest winds in the northeastern quadrant. It supported a high-confidence post-analysis position at 0000 UTC and a broader wind field than previously estimated.
Confidence in the later 0600 UTC centre is nevertheless LOW: subsequent microwave and scatterometer coverage was insufficient, and even the coastal IMD Doppler radar reflectivity did not resolve a discrete low-level centre. The warning specifies a position accuracy of 60 nautical miles. Initial intensity confidence is MEDIUM; wind-radii confidence is HIGH.
The accompanying imagery comprises the JTWC/SATOPS 0600 UTC image, FY-4B contrast-enhanced visible imagery at 0815:02 UTC, and FY-4B Band 13 infrared imagery at 0900:02 UTC. The visual enhancements improve presentation; they do not constitute a new intensity estimate. Source times, credits and scales are retained.
STEERING AND LANDFALL OUTLOOK
MURASU has slowed abruptly as the subtropical ridge splits into two anticyclonic cells, creating a weak-steering col. JTWC expects a more north-northwestward motion during the next 12–18 hours, with very slow movement and a possible brief stall immediately offshore.
Landfall along the Andhra Pradesh coast is forecast near forecast hour 12 — approximately 1800 UTC on 2 November, or 2330 IST. This timing is not fixed: additional slowing or a stronger northward turn could delay landfall and shift it farther north along the coast. The official forecast position at that time is 15.3°N, 80.2°E.
After landfall, the weakening circulation should move slowly northward before turning westward as it becomes shallower and decouples from the flow aloft. JTWC forecasts dissipation as a significant tropical cyclone over eastern India by 48 hours.
OFFICIAL JTWC FORECAST #06
Winds are maximum sustained one-minute winds; forecast hours are measured from 02 November 0600 UTC.
Hour | Valid time (UTC) | Position | Wind | Gust
0 | 02 Nov 0600 | 14.3°N 80.9°E | 65 kt | 80 kt
12 | 02 Nov 1800 | 15.3°N 80.2°E | 65 kt | 80 kt
24 | 03 Nov 0600 | 16.0°N 79.9°E | 50 kt | 65 kt
36 | 03 Nov 1800 | 16.4°N 79.9°E | 35 kt | 45 kt — dissipating inland
48 | 04 Nov 0600 | 16.6°N 79.6°E | 25 kt | 35 kt — dissipated as a significant tropical cyclone inland
WHY FURTHER INTENSIFICATION IS UNLIKELY IN THIS FORECAST
The large-scale environment remains marginally favourable: sea-surface temperatures of 30–31°C, deep-layer vertical wind shear of 5–10 kt, and strong poleward and equatorward outflow. These benefits are tempered by northwesterly mid-level shear and increasing land interaction.
JTWC expects dry continental air to enter the western inner core at low levels. Slow movement over shallow coastal waters may also promote local upwelling and reduce the oceanic heat supply. Friction and terrain should then drive rapid weakening after landfall.
MODEL GUIDANCE AND CONFIDENCE
JTWC reports broad track agreement, but many models do not resolve the subtle northward deflection. GFS, Google DeepMind, HAFS-A and HWRF capture that turn; the official forecast follows GFS and HAFS-A most closely. Track confidence is MEDIUM.
Most intensity guidance weakens MURASU immediately; SHIPS-GFS is the exception, showing modest strengthening before landfall. JTWC places its forecast 5 kt above the ICNW intensity consensus throughout the forecast period, with HIGH intensity-forecast confidence. The accompanying model comparison includes the official JTWC track and intensity forecast on both panels.
INTENSITY ESTIMATES AND THE 0530 UTC SATELLITE FIX
Estimates listed in the JTWC reasoning:
PGTW: T4.0 / 65 kt.
DEMS: T3.5 / 55 kt.
CIMSS ADT: 61 kt at 0530 UTC.
CIMSS AiDT: 57 kt at 0530 UTC.
CIMSS D-MINT: 54 kt at 0023 UTC.
CIMSS D-PRINT: 66 kt at 0530 UTC.
The PGTW fix at 0530 UTC places the centre at 14.13°N, 81.12°E using GK2A imagery. Its classification is T4.0/4.0, developing by 1.0 T-number over 24 hours, with a short-term increase of 0.5 over three hours. A well-defined central dense overcast approximately 100 nautical miles in diameter yields DT 4.0; MET and PT agree, and DT is the selected basis. That diameter describes the CDO, not an eye.
The fix explicitly warns that the intensity estimate may not be representative because of proximity to land. The accompanying CIMSS chart's 3-, 6- and 12-hour forecast dots are forecasts, not subsequent observations.
TWO SAR PASSES — A MATERIAL ADDITION TO THE INTENSITY REVIEW
Earlier acquisition: 01 November 1232:39 UTC, RCM-3.
Retrieved centre: 12.953°N, 83.601°E.
Quadrant maximum retrieved winds: NE 83.46 kt; SE 64.07 kt; SW 59.65 kt; NW 65.27 kt.
Reported RMax range: 6–9 nautical miles, approximately 11–17 km.
NOAA processing timestamp: 02 November 0025:07 UTC, 11 hours 52 minutes 28 seconds after acquisition. The exact online publication time is not provided by these files.
Later acquisition: 02 November 0029:30 UTC, RCM-3.
Retrieved centre: 13.897°N, 81.495°E.
Quadrant maximum retrieved winds: NE 71.32 kt; SE 52.21 kt; SW 40.73 kt; NW 51.83 kt.
Reported RMax range: 9–23 nautical miles, approximately 17–43 km.
NOAA processing timestamp: 02 November 0515:34 UTC.
The earlier pass reveals a more compact core and a higher northeastern wind maximum than the later pass. Its 83.46 kt retrieval is also substantially above the supplied revised JMV analysis of 55 kt at 1200 UTC on 1 November. This is an important reason to revisit the intensity peak and the subsequent evolution when further JMV/JTWC revisions become available.
SAR quadrant maxima are retrievals at the acquisition time; they cannot simply replace an official one-minute sustained intensity. The two passes alone do not determine a revised 24-hour intensity change. The comparison retains each source's full wind palette, scales and credits, with the later pass on the left and the earlier pass on the right.
RAPID INTENSIFICATION — CURRENT JMV RECORD AND RIPA CONTEXT
In the supplied revised JMV sequence, the intensity increases from 40 kt at 0600 UTC on 1 November to 65 kt at 0600 UTC on 2 November: +25 kt in 24 hours. That sequence does not meet the +30 kt/24-hour threshold used in this comparison. It also gives only +5 kt in the latest 12 hours, from 60 to 65 kt.
The much stronger intensification suggested by earlier RIPA guidance did not appear in that supplied JMV record. However, the delayed 1 November SAR pass raises a material question about the analysed peak. The RI assessment should therefore be revisited against any subsequent JMV/JTWC intensity revisions, rather than treating the present JMV sequence as a final post-season analysis.
For reference, the RIPA consensus probabilities in the 02 November 0600 UTC table are:
Gain / interval | Probability
20 kt / 12 h | 26.4%
25 kt / 24 h | 55.9%
30 kt / 24 h | 47.4%
35 kt / 24 h | 46.1%
40 kt / 24 h | 36.8%
45 kt / 36 h | 30.8%
55 kt / 36 h | 15.1%
55 kt / 48 h | 12.7%
70 kt / 48 h | 3.3%
65 kt / 72 h | 3.2%
These probabilities belong to the 0600 UTC run and apply forward from that run; they are not a verification of earlier runs. The separate RIPA shear diagnostics should not be equated directly with JTWC's assessed deep-layer shear, and its 2.6 km core predictor should not be labelled an eye diameter or a measured radius of maximum wind.
OFFICIAL WIND RADII
Radii in nautical miles, ordered NE / SE / SW / NW. Valid over open water only. A zero is the value in the warning, not a statement that no winds occur in that quadrant.
02 Nov 0600 UTC: 64 kt 25/25/0/0; 50 kt 50/40/0/20; 34 kt 80/70/55/50.
02 Nov 1800 UTC: 64 kt 20/20/0/0; 50 kt 40/30/0/20; 34 kt 70/70/50/50.
03 Nov 0600 UTC: 50 kt 20/20/0/0; 34 kt 50/50/30/30.
The main forecast issue is the slowing approach to the coast and the possible delay or northward shift of landfall. The main analysis issue is the earlier intensity peak highlighted by the delayed SAR pass. Forecast and analysis times must remain distinct throughout the comparison.
Sources: supplied JTWC warning #06 and prognostic reasoning; PGTW satellite fix; CIMSS ADT/AiDT chart; RAMMB/CIRA diagnostics and RIPA table; NOAA/NESDIS/STAR RCM-3 SAR images and information summaries; JTWC/SATOPS and Dapiya/FY-4B imagery. This text reflects those supplied products, not a subsequent bulletin update.
Compilation & analysis: Patrick Hoareau — Tropical Cyclone & Weather Monitoring