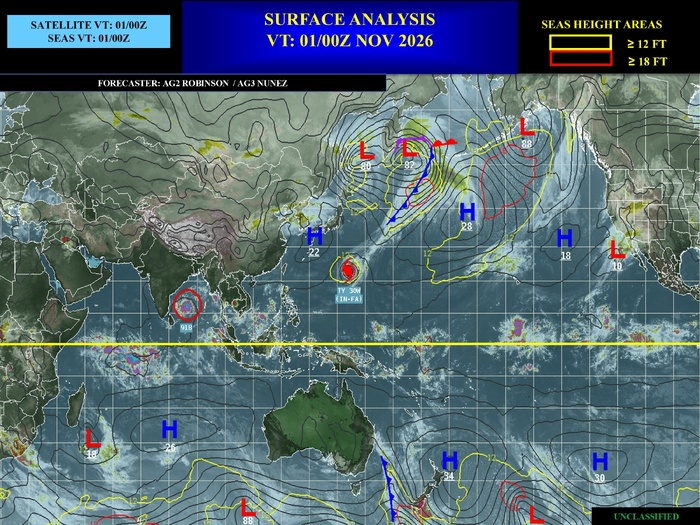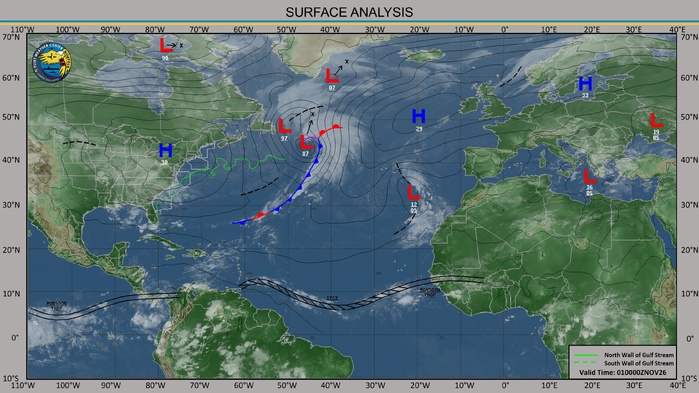


CLICK ON THE IMAGERIES BELOW TO GET THEM ENLARGED


TROPICAL CYCLONE 04B (MURASU) — RAPIDLY ORGANISING IN THE BAY OF BENGAL
Category 1 intensity forecast before the Andhra Pradesh coast
01 NOVEMBER 2026 | JTWC WARNING #3 ISSUED 1500 UTC
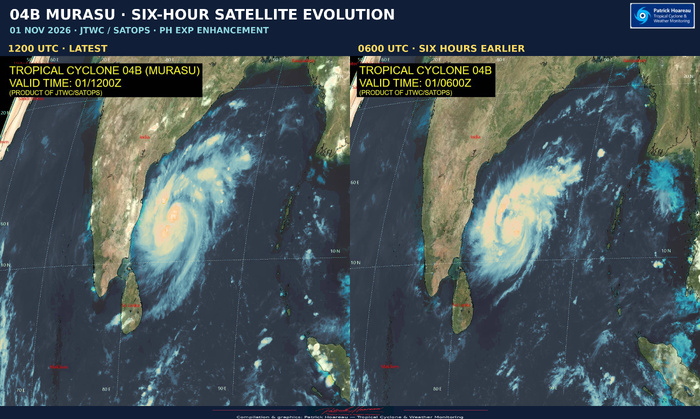
Analysis and JTWC/SATOPS satellite image: 1200 UTC
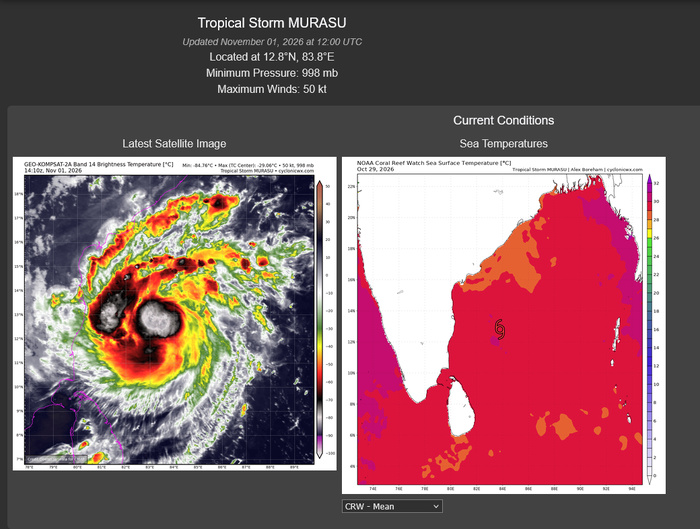
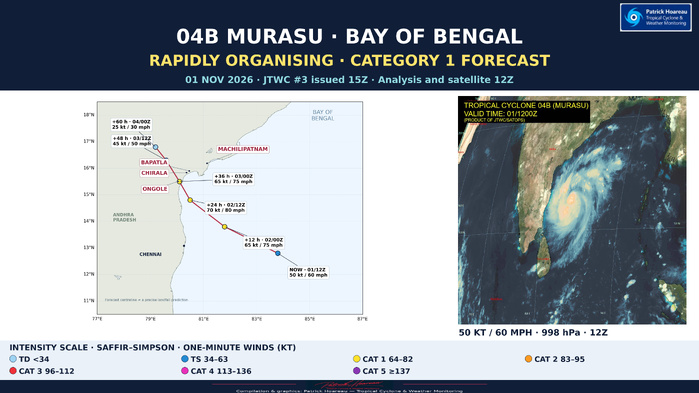
MURASU is consolidating quickly over the southwestern Bay of Bengal. At 1200 UTC, JTWC places the centre at 12.8°N, 83.8°E, with maximum sustained one-minute winds of 50 kt (60 mph), gusting to 65 kt (75 mph), and a minimum central pressure of 998 hPa. The cyclone has moved west-northwestward at 12 kt, approximately 14 mph / 22 km/h, over the past six hours.
The analysed wind has increased by 10 kt since the previous 0600 UTC warning analysis. This is a clear strengthening signal, although it does not by itself establish that the standard 24-hour rapid-intensification threshold has been met.
A COMPACT AND INCREASINGLY VIGOROUS CORE
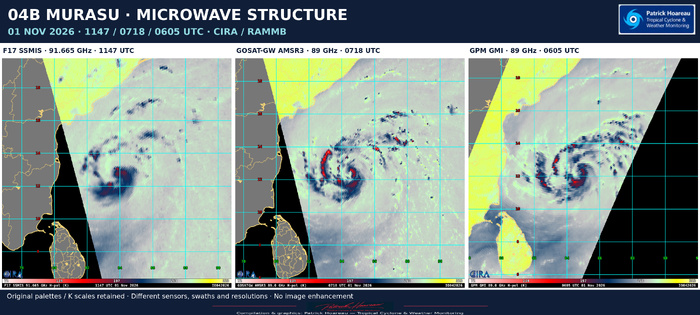
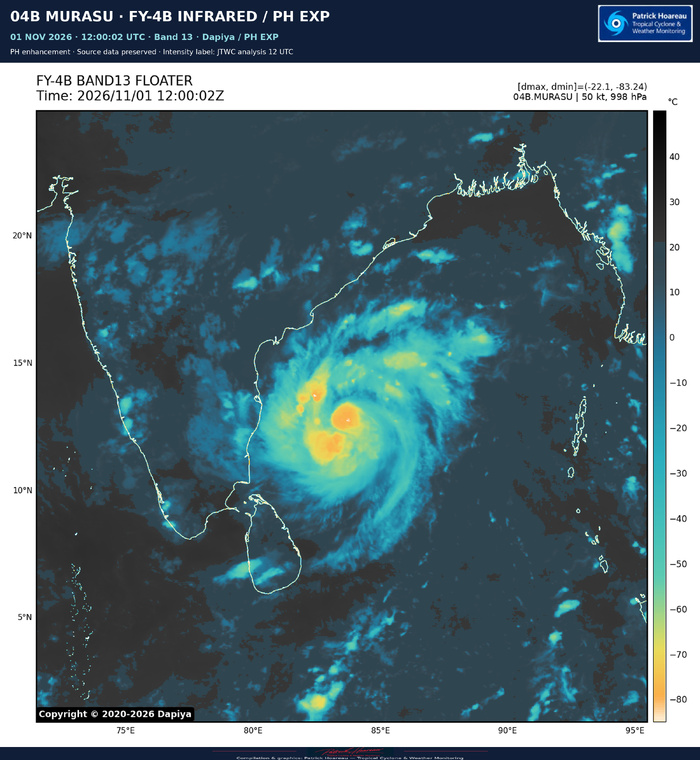
JTWC describes a highly compact central dense overcast with cloud tops colder than -85°C in the deepest convective updrafts. The 1147 UTC SSMIS 89-GHz image shows formative convective bands wrapping into the small low-level circulation from the southern semicircle.
The core is not free of interference. Moderate northwesterly shear in the middle levels is allowing a relatively dry, convection-free slot into its western flank. A developing warm spot helps locate the centre in infrared imagery, but this should not yet be presented as an established, clear eye.
Conditions otherwise favour further strengthening: sea-surface temperatures of 30–31°C, high ocean heat content, low deep-layer shear of 5–10 kt, and strong outflow both poleward and equatorward. Low deep-layer shear and stronger mid-level shear can coexist; the latter remains the principal limiting factor identified by JTWC.
The official initial intensity of 50 kt is the JTWC consensus/blended assessment of the available subjective and objective estimates. The individual PGTW 55 kt classification is one input to that assessment. Individual estimates span approximately 43–55 kt: PGTW T3.5 and CIMSS ADT give 55 kt, AiDT 43 kt, D-MINT 45 kt and D-PRINT 50 kt. Position and intensity confidence are medium; wind-radii confidence is low.
THE DETAILED 1130 UTC PGTW FIX
The fix issued at 1215 UTC gives T3.5 / CI3.5 at 12.65°N, 83.95°E, corresponding to 55 kt (65 mph). Tightly curved convection wraps 0.80 around a logarithmic spiral, yielding DT 3.5; MET is 3.0 and PT 3.5, with the final classification based on DT. It reports development of +1.5 T-number units over 24 hours and +0.5 over three hours. These are classification tendencies, not measured wind increments. The fix is a curved-band analysis, not an eye-pattern classification, and remains distinct from the later official 1200 UTC analysis of 50 kt. PL2 displays the full fix alongside the intensity estimates and official forecast.
TOWARDS THE ANDHRA PRADESH COAST — SLOWING, BUT NO OFFSHORE STALL IN THE LATEST GFS/ECMWF
The cyclone is tracking around the southwestern side of a subtropical ridge centred near coastal Myanmar. Over the next 12–24 hours, the ridge to its north is forecast to weaken and split into two centres, creating a region of weak steering near India's east coast.
MURASU should slow as it approaches the coastline. However, the ridge breakdown is now delayed by about 6–12 hours compared with previous model cycles. Neither the latest GFS nor ECMWF solution described in warning #3 depicts an offshore stall. This replaces the earlier cycle's stall possibility; it should not be carried forward as the current main scenario.
JTWC forecasts landfall around +36 hours, approximately 0000 UTC on 3 November — 0530 local time in India. The forecast centre is then near 15.5°N, 80.1°E, in the coastal vicinity of Ongole. Ongole, Chirala, Bapatla and Machilipatnam have been added to our map as geographical references, with Chennai farther south. These city markers are not a list of places guaranteed to receive the cyclone's centre or its strongest winds.
After landfall, the weakening circulation should move slowly inland, first northward and then northwestward. The forecast line is a centreline, not an uncertainty cone or a boundary of weather impacts.
CATEGORY 1 FORECAST — A HIGHER BRIEF PEAK REMAINS POSSIBLE
The official forecast reaches 65 kt (75 mph), equivalent to Category 1 on the Saffir–Simpson scale, by +12 hours, and 70 kt (80 mph) by +24 hours. It retains 65 kt at the +36-hour coastal point.
JTWC characterises the expected strengthening as near rapid intensification and allows for a higher peak immediately before landfall, potentially between the standard forecast times. The compact vortex may resist some of the mid-level shear but can also undergo rapid intensity fluctuations.
Intensity guidance remains divided. Some Google DeepMind guidance and HAFS-A favour limited additional strengthening, while CTCX, SHIPS and the intensity consensus are more aggressive, around 70–75 kt. Several probabilistic rapid-intensification aids are triggered and support the possibility of substantially stronger outcomes, including indications near 90 kt. That is a risk signal, not the official 90 kt forecast. The JTWC forecast follows CTCX more closely.
FORECAST TIMELINE — VALID TIMES IN UTC
Analysis | 01 Nov 1200 | 12.8°N 83.8°E | 50 kt / 60 mph
+12 h | 02 Nov 0000 | 13.8°N 81.8°E | 65 kt / 75 mph | Category 1 equivalent
+24 h | 02 Nov 1200 | 14.8°N 80.5°E | 70 kt / 80 mph | Category 1 equivalent
+36 h | 03 Nov 0000 | 15.5°N 80.1°E | 65 kt / 75 mph | Coastal / landfall period
+48 h | 03 Nov 1200 | 16.3°N 79.6°E | 45 kt / 50 mph | Weakening inland
+60 h | 04 Nov 0000 | 16.8°N 79.2°E | 25 kt / 30 mph | Dissipated as a significant TC over land
The latest warning gives high track confidence and medium intensity confidence. Its approximately 45-nm cross-track guidance spread near landfall is a model-spread measure, not a guaranteed landfall corridor or the full forecast uncertainty.
MODEL GUIDANCE — A COMMON COASTWARD TRACK, DIFFERENT INTENSITY SCENARIOS
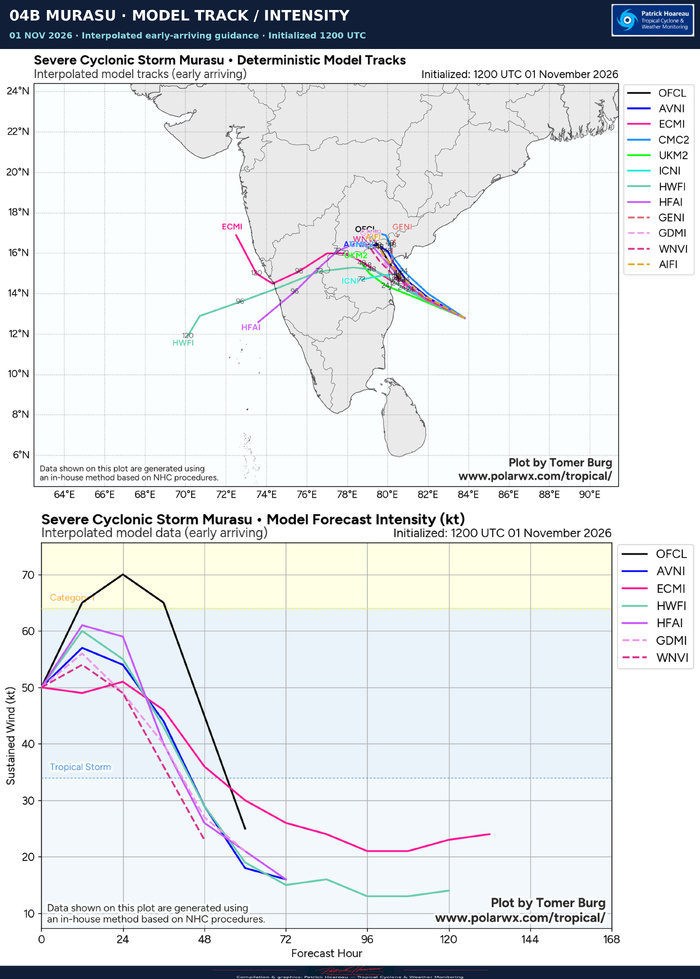
The supplied PolarWx deterministic/interpolated comparison is initialised at 1200 UTC. Its tracks generally converge towards India's east coast before the weakening circulation takes more divergent inland routes. Later westward or southwestward endpoints do not by themselves indicate a strong cyclone crossing the peninsula and redeveloping over the Arabian Sea.
The displayed early-arriving non-OFCL intensity curves generally peak around 50–60 kt, with HFAI a little above 60 kt. These are approximate graphical readings. The official black OFCL line is stronger, reaching 65 kt at +12 hours and 70 kt at +24 hours. This diagram is only part of the guidance available to the forecaster; the JTWC reasoning also considers more aggressive CTCX/SHIPS/consensus solutions and probabilistic rapid-intensification aids.
RAMMB / RIPA — A SIGNAL FOR FASTER STRENGTHENING
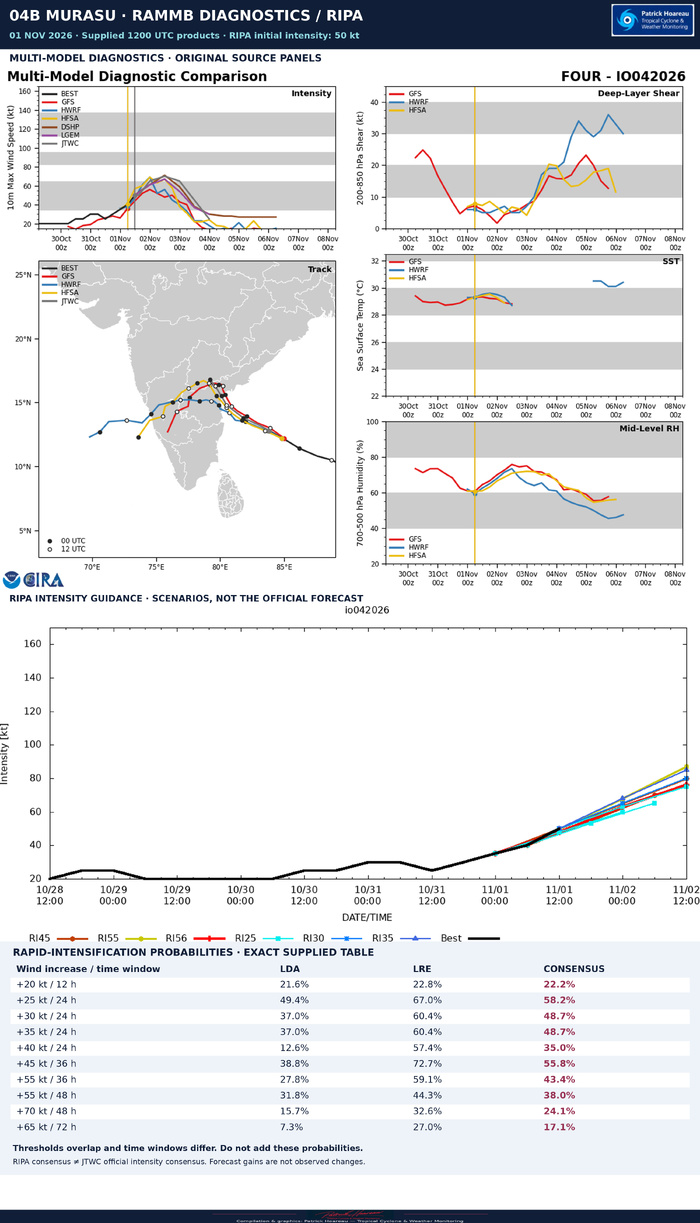
The supplied RIPA table is for 1200 UTC, initialised at 50 kt. Its consensus gives 58.2% for a gain of at least 25 kt in 24 hours, 48.7% for at least 30 kt in 24 hours, and 35.0% for at least 40 kt in 24 hours. From the initial 50 kt, the latter two change thresholds correspond to at least 80 kt and 90 kt at the end of the 24-hour interval. These are conditional guidance signals for intensification outcomes, not the official intensity forecast or evidence that rapid intensification has already occurred. The official +24-hour forecast remains 70 kt.
All ten probability thresholds are retained on the RAMMB/RIPA planche. They overlap and use different time windows, so their percentages must not be added. The RIPA LDA/LRE consensus is also distinct from the JTWC consensus/blended initial intensity analysis.
The RIPA shear predictor, around 21–25 kt during the first 24 hours, differs materially from the JTWC assessed deep-layer shear of 5–10 kt and from parts of the multi-model diagnostic plot. The supplied products do not establish why. Each is therefore retained within its own diagnostic framework; they are not merged into one common shear value.
SIX ENSEMBLES — AN EARLIER 0600 UTC PERSPECTIVE
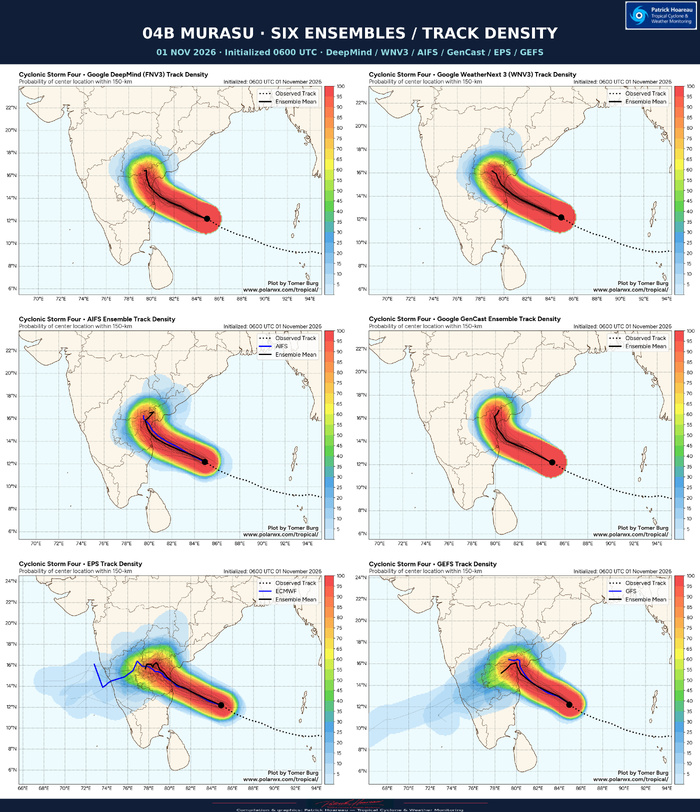
DeepMind FNV3, WeatherNext 3, AIFS, GenCast, ECMWF EPS and GFS GEFS support a broadly shared coastward corridor and subsequent more northward evolution. EPS and GEFS show broader westward tails among their members. The density shading is labelled centre-location probability within 150 km; it is not a probability of damaging winds, storm surge or landfall in a particular town.
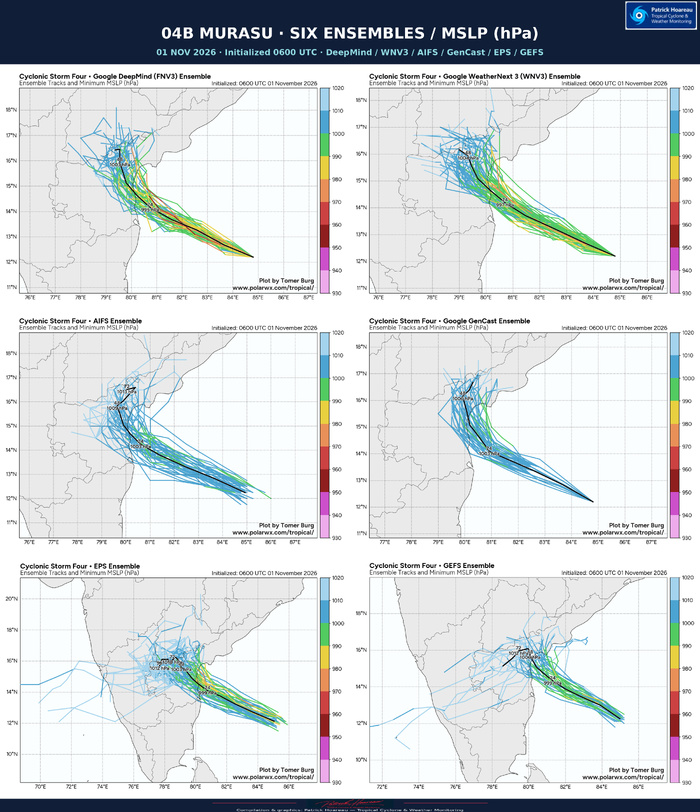
The companion mean-track pressure labels at +24 hours are 995 hPa for DeepMind, 997 for WeatherNext 3, 999 for EPS and GEFS, and 1003 for AIFS and GenCast. Those pressures are not the strongest-member minima and should not be converted directly into exact winds or Saffir–Simpson categories. Different initial cyclone representations also affect their absolute values.
All six ensemble products start at 0600 UTC, six hours before the official analysis and deterministic model comparison. Ensemble +24 hours is valid at 0600 UTC on 2 November, equivalent to official +18 hours. Ensemble +48 hours corresponds to official +42 hours. Comparisons must match valid times, not just equal forecast-hour numbers.
MARINE CONDITIONS
JTWC estimates significant wave height at 22 feet, approximately 6.7 metres, at 1200 UTC. This is a significant-wave-height estimate in the cyclone environment, not a uniform coastal wave height, maximum individual wave, or storm-surge forecast. Strong winds, heavy rain and dangerous seas can extend away from the forecast centreline. Coastal and marine decisions should follow the relevant Indian official warnings.
READING THE FOCUS
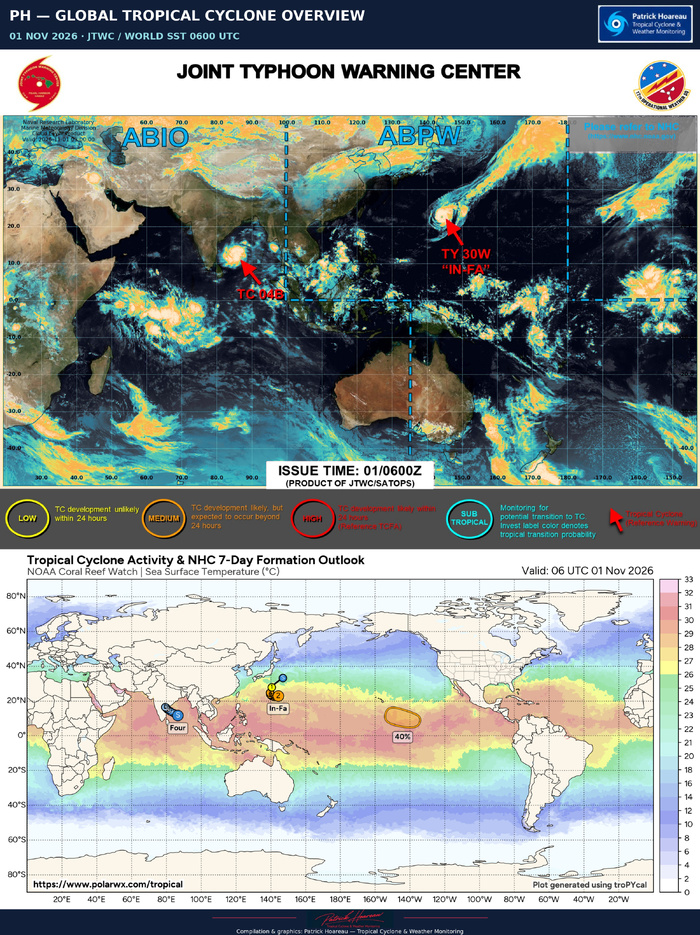
The PH map uses the exact forecast positions from warning #3. The satellite panel uses the supplied 1200 UTC JTWC/SATOPS image with the established PH display enhancement; its colours do not constitute a calibrated cloud-top-temperature scale. The separate JTWC/PolarWx stitch retains both supplied charts in full, including legends, timestamps and credits. Forecast hours run from the 1200 UTC analysis, three hours before issuance.
Sources: supplied JTWC warning #3 and prognostic reasoning issued 1500 UTC on 1 November 2026; JTWC/SATOPS imagery valid 1200 UTC; PolarWx forecast/SST chart. Coastal-city positions checked against GeoNames, OpenStreetMap and the Getty Thesaurus of Geographic Names.
More cyclone monitoring:
https://www.meteo974.re/JTWC-Patrick-Hoareau_r7.html
Facebook: JTWCPH
Cheers, Patrick Hoareau.
Tropical Cyclone & Weather Monitoring.
Category 1 intensity forecast before the Andhra Pradesh coast
01 NOVEMBER 2026 | JTWC WARNING #3 ISSUED 1500 UTC
Analysis and JTWC/SATOPS satellite image: 1200 UTC
MURASU is consolidating quickly over the southwestern Bay of Bengal. At 1200 UTC, JTWC places the centre at 12.8°N, 83.8°E, with maximum sustained one-minute winds of 50 kt (60 mph), gusting to 65 kt (75 mph), and a minimum central pressure of 998 hPa. The cyclone has moved west-northwestward at 12 kt, approximately 14 mph / 22 km/h, over the past six hours.
The analysed wind has increased by 10 kt since the previous 0600 UTC warning analysis. This is a clear strengthening signal, although it does not by itself establish that the standard 24-hour rapid-intensification threshold has been met.
A COMPACT AND INCREASINGLY VIGOROUS CORE
JTWC describes a highly compact central dense overcast with cloud tops colder than -85°C in the deepest convective updrafts. The 1147 UTC SSMIS 89-GHz image shows formative convective bands wrapping into the small low-level circulation from the southern semicircle.
The core is not free of interference. Moderate northwesterly shear in the middle levels is allowing a relatively dry, convection-free slot into its western flank. A developing warm spot helps locate the centre in infrared imagery, but this should not yet be presented as an established, clear eye.
Conditions otherwise favour further strengthening: sea-surface temperatures of 30–31°C, high ocean heat content, low deep-layer shear of 5–10 kt, and strong outflow both poleward and equatorward. Low deep-layer shear and stronger mid-level shear can coexist; the latter remains the principal limiting factor identified by JTWC.
The official initial intensity of 50 kt is the JTWC consensus/blended assessment of the available subjective and objective estimates. The individual PGTW 55 kt classification is one input to that assessment. Individual estimates span approximately 43–55 kt: PGTW T3.5 and CIMSS ADT give 55 kt, AiDT 43 kt, D-MINT 45 kt and D-PRINT 50 kt. Position and intensity confidence are medium; wind-radii confidence is low.
THE DETAILED 1130 UTC PGTW FIX
The fix issued at 1215 UTC gives T3.5 / CI3.5 at 12.65°N, 83.95°E, corresponding to 55 kt (65 mph). Tightly curved convection wraps 0.80 around a logarithmic spiral, yielding DT 3.5; MET is 3.0 and PT 3.5, with the final classification based on DT. It reports development of +1.5 T-number units over 24 hours and +0.5 over three hours. These are classification tendencies, not measured wind increments. The fix is a curved-band analysis, not an eye-pattern classification, and remains distinct from the later official 1200 UTC analysis of 50 kt. PL2 displays the full fix alongside the intensity estimates and official forecast.
TOWARDS THE ANDHRA PRADESH COAST — SLOWING, BUT NO OFFSHORE STALL IN THE LATEST GFS/ECMWF
The cyclone is tracking around the southwestern side of a subtropical ridge centred near coastal Myanmar. Over the next 12–24 hours, the ridge to its north is forecast to weaken and split into two centres, creating a region of weak steering near India's east coast.
MURASU should slow as it approaches the coastline. However, the ridge breakdown is now delayed by about 6–12 hours compared with previous model cycles. Neither the latest GFS nor ECMWF solution described in warning #3 depicts an offshore stall. This replaces the earlier cycle's stall possibility; it should not be carried forward as the current main scenario.
JTWC forecasts landfall around +36 hours, approximately 0000 UTC on 3 November — 0530 local time in India. The forecast centre is then near 15.5°N, 80.1°E, in the coastal vicinity of Ongole. Ongole, Chirala, Bapatla and Machilipatnam have been added to our map as geographical references, with Chennai farther south. These city markers are not a list of places guaranteed to receive the cyclone's centre or its strongest winds.
After landfall, the weakening circulation should move slowly inland, first northward and then northwestward. The forecast line is a centreline, not an uncertainty cone or a boundary of weather impacts.
CATEGORY 1 FORECAST — A HIGHER BRIEF PEAK REMAINS POSSIBLE
The official forecast reaches 65 kt (75 mph), equivalent to Category 1 on the Saffir–Simpson scale, by +12 hours, and 70 kt (80 mph) by +24 hours. It retains 65 kt at the +36-hour coastal point.
JTWC characterises the expected strengthening as near rapid intensification and allows for a higher peak immediately before landfall, potentially between the standard forecast times. The compact vortex may resist some of the mid-level shear but can also undergo rapid intensity fluctuations.
Intensity guidance remains divided. Some Google DeepMind guidance and HAFS-A favour limited additional strengthening, while CTCX, SHIPS and the intensity consensus are more aggressive, around 70–75 kt. Several probabilistic rapid-intensification aids are triggered and support the possibility of substantially stronger outcomes, including indications near 90 kt. That is a risk signal, not the official 90 kt forecast. The JTWC forecast follows CTCX more closely.
FORECAST TIMELINE — VALID TIMES IN UTC
Analysis | 01 Nov 1200 | 12.8°N 83.8°E | 50 kt / 60 mph
+12 h | 02 Nov 0000 | 13.8°N 81.8°E | 65 kt / 75 mph | Category 1 equivalent
+24 h | 02 Nov 1200 | 14.8°N 80.5°E | 70 kt / 80 mph | Category 1 equivalent
+36 h | 03 Nov 0000 | 15.5°N 80.1°E | 65 kt / 75 mph | Coastal / landfall period
+48 h | 03 Nov 1200 | 16.3°N 79.6°E | 45 kt / 50 mph | Weakening inland
+60 h | 04 Nov 0000 | 16.8°N 79.2°E | 25 kt / 30 mph | Dissipated as a significant TC over land
The latest warning gives high track confidence and medium intensity confidence. Its approximately 45-nm cross-track guidance spread near landfall is a model-spread measure, not a guaranteed landfall corridor or the full forecast uncertainty.
MODEL GUIDANCE — A COMMON COASTWARD TRACK, DIFFERENT INTENSITY SCENARIOS
The supplied PolarWx deterministic/interpolated comparison is initialised at 1200 UTC. Its tracks generally converge towards India's east coast before the weakening circulation takes more divergent inland routes. Later westward or southwestward endpoints do not by themselves indicate a strong cyclone crossing the peninsula and redeveloping over the Arabian Sea.
The displayed early-arriving non-OFCL intensity curves generally peak around 50–60 kt, with HFAI a little above 60 kt. These are approximate graphical readings. The official black OFCL line is stronger, reaching 65 kt at +12 hours and 70 kt at +24 hours. This diagram is only part of the guidance available to the forecaster; the JTWC reasoning also considers more aggressive CTCX/SHIPS/consensus solutions and probabilistic rapid-intensification aids.
RAMMB / RIPA — A SIGNAL FOR FASTER STRENGTHENING
The supplied RIPA table is for 1200 UTC, initialised at 50 kt. Its consensus gives 58.2% for a gain of at least 25 kt in 24 hours, 48.7% for at least 30 kt in 24 hours, and 35.0% for at least 40 kt in 24 hours. From the initial 50 kt, the latter two change thresholds correspond to at least 80 kt and 90 kt at the end of the 24-hour interval. These are conditional guidance signals for intensification outcomes, not the official intensity forecast or evidence that rapid intensification has already occurred. The official +24-hour forecast remains 70 kt.
All ten probability thresholds are retained on the RAMMB/RIPA planche. They overlap and use different time windows, so their percentages must not be added. The RIPA LDA/LRE consensus is also distinct from the JTWC consensus/blended initial intensity analysis.
The RIPA shear predictor, around 21–25 kt during the first 24 hours, differs materially from the JTWC assessed deep-layer shear of 5–10 kt and from parts of the multi-model diagnostic plot. The supplied products do not establish why. Each is therefore retained within its own diagnostic framework; they are not merged into one common shear value.
SIX ENSEMBLES — AN EARLIER 0600 UTC PERSPECTIVE
DeepMind FNV3, WeatherNext 3, AIFS, GenCast, ECMWF EPS and GFS GEFS support a broadly shared coastward corridor and subsequent more northward evolution. EPS and GEFS show broader westward tails among their members. The density shading is labelled centre-location probability within 150 km; it is not a probability of damaging winds, storm surge or landfall in a particular town.
The companion mean-track pressure labels at +24 hours are 995 hPa for DeepMind, 997 for WeatherNext 3, 999 for EPS and GEFS, and 1003 for AIFS and GenCast. Those pressures are not the strongest-member minima and should not be converted directly into exact winds or Saffir–Simpson categories. Different initial cyclone representations also affect their absolute values.
All six ensemble products start at 0600 UTC, six hours before the official analysis and deterministic model comparison. Ensemble +24 hours is valid at 0600 UTC on 2 November, equivalent to official +18 hours. Ensemble +48 hours corresponds to official +42 hours. Comparisons must match valid times, not just equal forecast-hour numbers.
MARINE CONDITIONS
JTWC estimates significant wave height at 22 feet, approximately 6.7 metres, at 1200 UTC. This is a significant-wave-height estimate in the cyclone environment, not a uniform coastal wave height, maximum individual wave, or storm-surge forecast. Strong winds, heavy rain and dangerous seas can extend away from the forecast centreline. Coastal and marine decisions should follow the relevant Indian official warnings.
READING THE FOCUS
The PH map uses the exact forecast positions from warning #3. The satellite panel uses the supplied 1200 UTC JTWC/SATOPS image with the established PH display enhancement; its colours do not constitute a calibrated cloud-top-temperature scale. The separate JTWC/PolarWx stitch retains both supplied charts in full, including legends, timestamps and credits. Forecast hours run from the 1200 UTC analysis, three hours before issuance.
Sources: supplied JTWC warning #3 and prognostic reasoning issued 1500 UTC on 1 November 2026; JTWC/SATOPS imagery valid 1200 UTC; PolarWx forecast/SST chart. Coastal-city positions checked against GeoNames, OpenStreetMap and the Getty Thesaurus of Geographic Names.
More cyclone monitoring:
https://www.meteo974.re/JTWC-Patrick-Hoareau_r7.html
Facebook: JTWCPH
Cheers, Patrick Hoareau.
Tropical Cyclone & Weather Monitoring.

04B MURASU — PL2 INTENSITY
01 NOVEMBER 2026
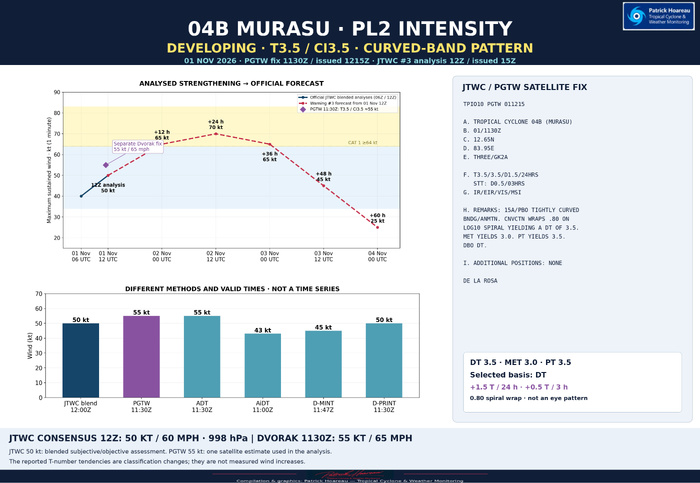
The PGTW satellite fix valid at 1130 UTC and issued at 1215 UTC gives T3.5 / CI3.5, corresponding to a Dvorak intensity estimate of 55 kt (65 mph). It places the centre at 12.65°N, 83.95°E using GK2A imagery. The official JTWC intensity is a consensus/blended assessment of the available subjective and objective estimates; the PGTW 55 kt fix is one input. Warning #3 analyses the system at 1200 UTC at: 12.8°N, 83.8°E, 50 kt (60 mph), 998 hPa.
The classification is based on tightly curved convective banding. Convection wraps 0.80 around a logarithmic spiral, yielding DT 3.5. MET is 3.0 and PT is 3.5; the final classification is based on DT. It is a curved-band pattern, not an eye-pattern fix.
The reported development is +1.5 T-number units over 24 hours, with +0.5 over the latest three hours. These are reported Dvorak classification tendencies, not measured wind increments or a reconstructed sequence of earlier fixes. They support an organising, strengthening system, but do not alone establish a verified rapid-intensification event.
Other estimates quoted in the current prognostic reasoning are ADT 55 kt at 1130 UTC, AiDT 43 kt at 1100 UTC, D-MINT 45 kt at 1147 UTC and D-PRINT 50 kt at 1130 UTC. Methods and valid times differ; the bar panel is a comparison, not a time series. The supplied PGTW fix provides the detailed 1130 UTC classification quoted in the reasoning.
The upper chart separates the official 0600 and 1200 UTC analyses (40 and 50 kt) from the warning #3 forecast: 65 kt at +12 h, 70 at +24 h, 65 at +36 h, 45 at +48 h and 25 at +60 h. Forecast hours begin at 1200 UTC on 1 November. Landfall is forecast around +36 h, approximately 0000 UTC on 3 November. JTWC allows a higher brief peak between the standard forecast times; 70 kt is the highest tabulated forecast intensity, not a hard upper bound.
Cheers, Patrick Hoareau.
Tropical Cyclone & Weather Monitoring.
01 NOVEMBER 2026
The PGTW satellite fix valid at 1130 UTC and issued at 1215 UTC gives T3.5 / CI3.5, corresponding to a Dvorak intensity estimate of 55 kt (65 mph). It places the centre at 12.65°N, 83.95°E using GK2A imagery. The official JTWC intensity is a consensus/blended assessment of the available subjective and objective estimates; the PGTW 55 kt fix is one input. Warning #3 analyses the system at 1200 UTC at: 12.8°N, 83.8°E, 50 kt (60 mph), 998 hPa.
The classification is based on tightly curved convective banding. Convection wraps 0.80 around a logarithmic spiral, yielding DT 3.5. MET is 3.0 and PT is 3.5; the final classification is based on DT. It is a curved-band pattern, not an eye-pattern fix.
The reported development is +1.5 T-number units over 24 hours, with +0.5 over the latest three hours. These are reported Dvorak classification tendencies, not measured wind increments or a reconstructed sequence of earlier fixes. They support an organising, strengthening system, but do not alone establish a verified rapid-intensification event.
Other estimates quoted in the current prognostic reasoning are ADT 55 kt at 1130 UTC, AiDT 43 kt at 1100 UTC, D-MINT 45 kt at 1147 UTC and D-PRINT 50 kt at 1130 UTC. Methods and valid times differ; the bar panel is a comparison, not a time series. The supplied PGTW fix provides the detailed 1130 UTC classification quoted in the reasoning.
The upper chart separates the official 0600 and 1200 UTC analyses (40 and 50 kt) from the warning #3 forecast: 65 kt at +12 h, 70 at +24 h, 65 at +36 h, 45 at +48 h and 25 at +60 h. Forecast hours begin at 1200 UTC on 1 November. Landfall is forecast around +36 h, approximately 0000 UTC on 3 November. JTWC allows a higher brief peak between the standard forecast times; 70 kt is the highest tabulated forecast intensity, not a hard upper bound.
Cheers, Patrick Hoareau.
Tropical Cyclone & Weather Monitoring.