

CLICK ON THE IMAGERIES BELOW TO GET THEM ENLARGED


TYPHOON 30W (IN-FA) — US CATEGORY 4
An impressive eye with mesovortices, a small clockwise loop and gradual weakening ahead
31 OCTOBER 2026 | 0300 UTC | JTWC WARNING #31
Analysis and satellite image: 0000 UTC
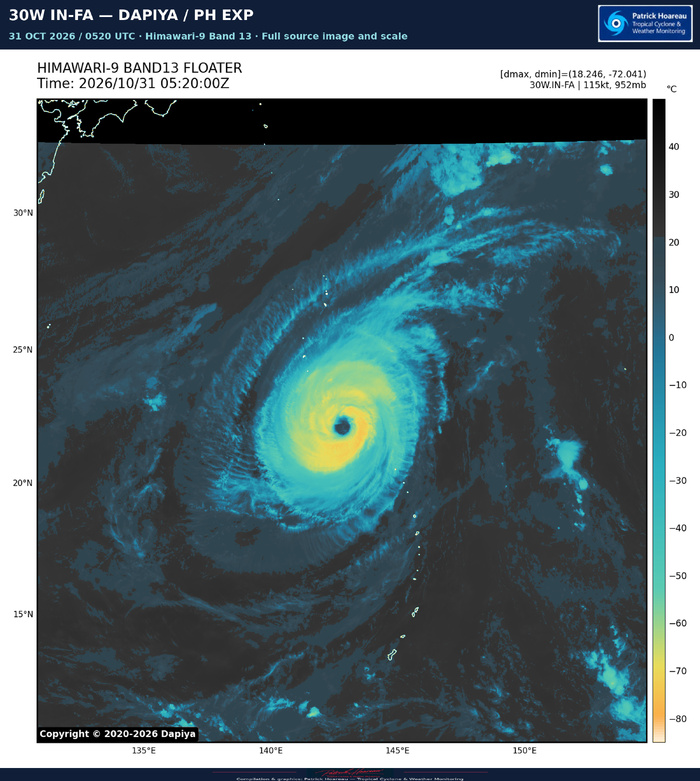
IN-FA remains a powerful Category 4 typhoon in the Western North Pacific, with maximum sustained one-minute winds of 115 kt (130 mph). The official JTWC warning gives a minimum central pressure of 952 hPa at 0000 UTC. The centre is at 21.5°N, 142.8°E, approximately 398 km south-southeast of Iwo To, moving north-northwestward at 11 kt (about 20 km/h).
AN IMPRESSIVE EYE, WITH MESOVORTICES
JTWC reports that the roughly 74-km-wide eye contains several mesovortices. The eye temperature remains near +19°C, while the coldest surrounding cloud tops have oscillated between -65 and -75°C. A 2211 UTC SSMIS pass on 30 October shows small convective bands beginning to develop on the northern and southern flanks. The core remains strikingly organised, although these emerging bands suggest some evolution from its earlier, more purely annular appearance.
The environment remains favourable, with 5–10 kt vertical wind shear, 28–29°C sea-surface temperatures and strong radial outflow. However, the typhoon is entering lower ocean heat content, below 75 kJ/cm², reducing the ocean's reserve of warm water beneath the surface.
Confidence in the initial position and intensity is high. PGTW and RJTD both give T6.0 / 115 kt. Other estimates include SATCON 113 kt and D-MINT 115 kt at 2212 UTC, plus AiDT 116 kt and D-PRINT 114 kt at 2330 UTC on 30 October. ADT is lower at 97 kt. Wind radii are based on persistence, with medium confidence.
THE LATEST JMV RECORD
The supplied operational record retains 125 kt at 30 October 0000 UTC, 120 kt at 0600 UTC and 115 kt at 1200 and 1800 UTC, followed by 115 kt at 31 October 0000 UTC. This represents little intensity change over the latest 12 hours, within a broader weakening trend. These operational analyses remain preliminary and subject to revision. The official warning pressure of 952 hPa supersedes the 951 hPa shown in the earlier CyclonicWx snapshot for this focus.
A SMALL CLOCKWISE LOOP
IN-FA has begun its poleward turn. It should continue northward to northeastward during the next 12 hours, then slow and execute a small clockwise loop as a trough passing to the north weakens the subtropical ridge to the northeast.
After +36 hours, a separate ridge building from the west should steer the typhoon west-northwestward through about +60 hours. A second, weaker trough then erodes that western ridge, allowing the original eastern ridge to regain influence. Another northeastward turn is forecast no later than +72 hours.
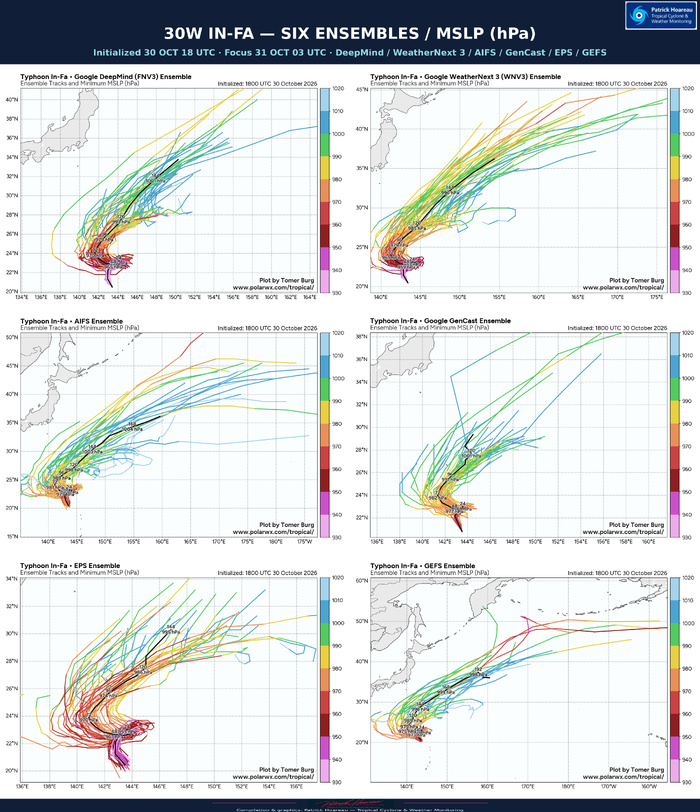
Guidance has moved into better agreement, although UKMET and its ensemble remain notably farther equatorward. Excluding those outliers, day-five cross-track spread is approximately 537 km and along-track spread approximately 222 km. The timing of the first trough and subsequent ridge rebuilding remains the principal uncertainty. Most AI solutions, now joined by ECMWF and its ensemble mean, lie on the eastern side, while AI GFS and experimental WeatherMesh lie west of the physics-based consensus. The JTWC forecast lies between the multi-model and AI consensus, closer to the latter. Track confidence remains low throughout.
WEAKENING, WITH A STEEPER DECLINE LATE IN THE PERIOD
The official forecast decreases from 115 kt now to 110 kt at +12 hours, 105 kt at +24, 95 kt at +36, 90 kt at +48, 85 kt at +60, 80 kt at +72, 75 kt at +96 and 55 kt at +120 hours. The final point is therefore at tropical-storm intensity.
Lower ocean heat content and slow motion around the loop favour upwelling of cooler water and a steeper decline between +24 and +36 hours. Weakening then slows as forward speed increases and IN-FA moves away from its cool wake. Around +96 hours, a sharp increase in shear near the strong upper-level westerlies should promote renewed, faster weakening.
Some mesoscale guidance still permits reintensification near +48 hours along more equatorward tracks. The official intensity forecast agrees more closely with the Google DeepMind models and GFS-based COAMPS-TC, whose tracks align better with the JTWC solution. Intensity confidence remains low throughout the five-day forecast.
READING THE PL1
The left panel plots the exact warning #31 forecast positions, coloured by US intensity category. The right panel shows our enhanced 0000 UTC JTWC / SATOPS image. Forecast hours begin at the 0000 UTC analysis, three hours before warning issuance.
Sources: JTWC warning #31, prognostic reasoning, latest JMV record and SATOPS imagery.
Cheers, Patrick Hoareau.
Tropical Cyclone & Weather Monitoring.


TYPHOON 30W (IN-FA) — INTENSITY FOCUS
A steady 115 kt analysis, with gradual weakening ahead
31 OCTOBER 2026 | JTWC WARNING #31
At 0000 UTC, JTWC analyses IN-FA at 115 kt (130 mph), US Category 4, with a minimum central pressure of 952 hPa. The latest JMV retains 125 kt at 30 October 00 UTC, 120 kt at 06 UTC and 115 kt at 12 and 18 UTC, followed by 115 kt at 31 October 00 UTC. Thus the latest operational record shows little change over 12 hours, within a broader weakening trend. These analyses remain preliminary and subject to revision.
The 0230 UTC JTWC satellite fix gives FT 6.0 / CI 6.0. The eye-pattern E-number is 5.0, with a +1.0 eye adjustment yielding DT 6.0. MET and PT agree, and the final classification is based on DT. Both the 24-hour tendency and the three-hour short-term tendency are steady. The fix position is 21.70°N, 142.71°E, distinct from the earlier 0000 UTC warning position. An additional SSMIS position is listed at 30 October 2212 UTC: 21.03°N, 142.98°E.
At 0400 UTC, CIMSS gives ADT 110 kt and AiDT 112 kt. These later estimates are close to the official 115 kt analysis, although they use different methods and valid times. The AiDT short-range forecasts are 111 kt at +3 hours, 112 kt at +6 and 110 kt at +12. These future values are forecasts, not observations.
Warning #31 forecasts 110 kt at +12 hours, 105 kt at +24, 95 kt at +36, 90 kt at +48, 85 kt at +60, 80 kt at +72, 75 kt at +96 and 55 kt at +120. Forecast hours begin at the 0000 UTC analysis. Lower ocean heat content and slow motion around the expected clockwise loop favour upwelling and stronger weakening between +24 and +36 hours. Weakening then slows as forward motion increases, before shear rises sharply around +96 hours near the upper-level westerlies.
Initial intensity confidence is high, but forecast intensity confidence remains low throughout the five-day period. Some mesoscale models allow reintensification along more equatorward tracks. The official solution is closer to Google DeepMind and GFS-based COAMPS-TC, whose tracks align better with JTWC.
The full CIMSS screenshot is preserved. Its source line labelled Best Track is separate from the latest operational JMV history in the upper chart. The purple future points are model estimates.
Cheers, Patrick Hoareau.
Tropical Cyclone & Weather Monitoring.


TYPHOON 30W (IN-FA) — MODEL TRACK AND INTENSITY COMPARISON
A shared initial weakening trend, but different routes around the loop
31 OCTOBER 2026 | 0300 UTC FOCUS
Interpolated early-arriving guidance initialized at 0000 UTC
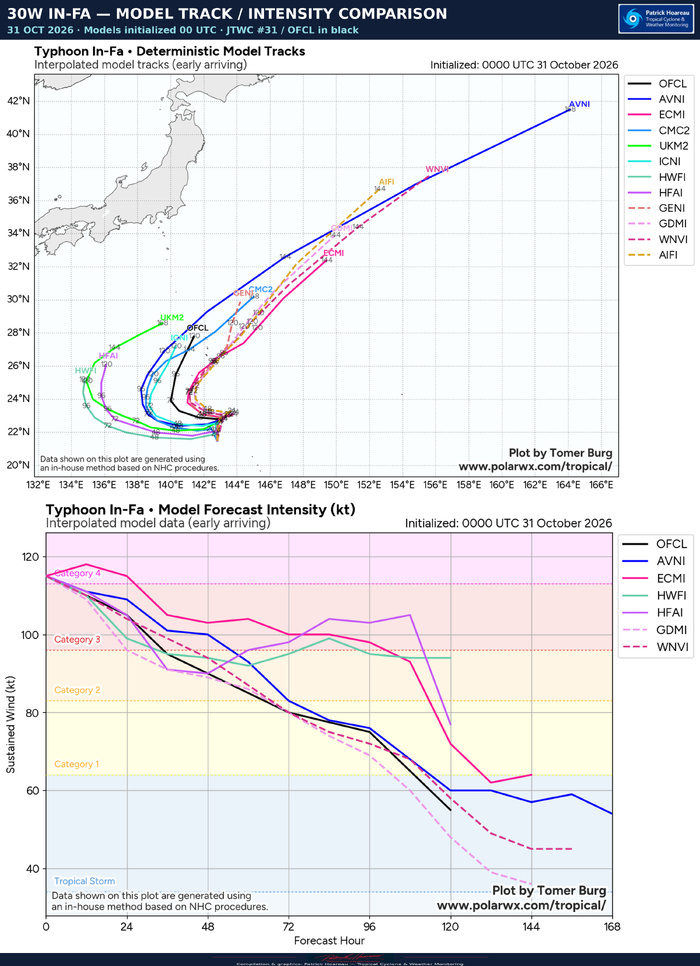
The black OFCL line represents JTWC warning #31. The upper panel compares forecast tracks; the lower panel compares maximum sustained winds in knots. Both source charts are reproduced in full, with their original legends, forecast-hour labels and credits.
TRACK: THE WESTWARD DEFLECTION STILL SEPARATES THE MODELS
The guidance initially clusters near 23°N before a small clockwise turn and westward deflection. The main split concerns how far west IN-FA travels before turning poleward again. HAFS-A, HWRF and UKMET occupy the western side of the displayed guidance, while ECMWF and the displayed AI solutions generally turn farther east. GFS is particularly progressive northeastward later in the period. The JTWC forecast lies between the eastern and western groups.
The official reasoning reports improved agreement. Excluding the UKMET and UKMET ensemble outliers, the day-five cross-track spread is approximately 537 km, with an along-track spread near 222 km. This qualified spread should not be mistaken for the full range of all guidance. JTWC retains low track confidence throughout, with its forecast between the multi-model and AI consensus but closer to the AI consensus.
The timing of the passing trough, the rebuilding of the western ridge and the subsequent erosion of that ridge determine the loop and eventual northeastward turn. These track differences also affect the ocean heat content encountered, the time spent near the cool wake and exposure to increasing shear.
INTENSITY: WEAKENING FIRST, THEN A SPLIT
All displayed solutions are weaker by +36 hours, although ECMWF allows a small initial increase. After the initial decline, HAFS-A and HWRF show some recovery; ECMWF also maintains a stronger cyclone than OFCL for much of the middle forecast period. In contrast, GFS, DeepMind and WeatherNext broadly favour continued weakening.
The official forecast decreases from 115 kt (130 mph) at 0000 UTC to 110 kt at +12 hours, 105 kt at +24, 95 kt at +36, 90 kt at +48, 85 kt at +60, 80 kt at +72, 75 kt at +96 and 55 kt at +120. The final point is at tropical-storm intensity. The displayed HAFS-A solution recovers toward roughly 105 kt before a sharp decline near day five; HWRF remains around the mid-90 kt range late in its plotted period. These are alternative model scenarios, not equivalent confidence estimates.
JTWC links the initial weakening to lower ocean heat content and slow motion around the loop, with upwelling favouring a steeper decrease between +24 and +36 hours. Faster motion later helps the cyclone outpace its cool wake. A sharp shear increase around +96 hours then favours a faster decline. Official intensity confidence remains low throughout.
The diagrams show interpolated early-arriving deterministic guidance, distinct from ensemble-density and minimum-pressure products. Forecast lengths differ between models and are preserved as supplied.
Cheers, Patrick Hoareau.
Tropical Cyclone & Weather Monitoring.


TYPHOON 30W (IN-FA) — MODEL TRACK AND INTENSITY COMPARISON
A shared initial weakening trend, but different routes around the loop
31 OCTOBER 2026 | 0300 UTC FOCUS
Interpolated early-arriving guidance initialized at 0000 UTC
The black OFCL line represents JTWC warning #31. The upper panel compares forecast tracks; the lower panel compares maximum sustained winds in knots. Both source charts are reproduced in full, with their original legends, forecast-hour labels and credits.
TRACK: THE WESTWARD DEFLECTION STILL SEPARATES THE MODELS
The guidance initially clusters near 23°N before a small clockwise turn and westward deflection. The main split concerns how far west IN-FA travels before turning poleward again. HAFS-A, HWRF and UKMET occupy the western side of the displayed guidance, while ECMWF and the displayed AI solutions generally turn farther east. GFS is particularly progressive northeastward later in the period. The JTWC forecast lies between the eastern and western groups.
The official reasoning reports improved agreement. Excluding the UKMET and UKMET ensemble outliers, the day-five cross-track spread is approximately 537 km, with an along-track spread near 222 km. This qualified spread should not be mistaken for the full range of all guidance. JTWC retains low track confidence throughout, with its forecast between the multi-model and AI consensus but closer to the AI consensus.
The timing of the passing trough, the rebuilding of the western ridge and the subsequent erosion of that ridge determine the loop and eventual northeastward turn. These track differences also affect the ocean heat content encountered, the time spent near the cool wake and exposure to increasing shear.
INTENSITY: WEAKENING FIRST, THEN A SPLIT
All displayed solutions are weaker by +36 hours, although ECMWF allows a small initial increase. After the initial decline, HAFS-A and HWRF show some recovery; ECMWF also maintains a stronger cyclone than OFCL for much of the middle forecast period. In contrast, GFS, DeepMind and WeatherNext broadly favour continued weakening.
The official forecast decreases from 115 kt (130 mph) at 0000 UTC to 110 kt at +12 hours, 105 kt at +24, 95 kt at +36, 90 kt at +48, 85 kt at +60, 80 kt at +72, 75 kt at +96 and 55 kt at +120. The final point is at tropical-storm intensity. The displayed HAFS-A solution recovers toward roughly 105 kt before a sharp decline near day five; HWRF remains around the mid-90 kt range late in its plotted period. These are alternative model scenarios, not equivalent confidence estimates.
JTWC links the initial weakening to lower ocean heat content and slow motion around the loop, with upwelling favouring a steeper decrease between +24 and +36 hours. Faster motion later helps the cyclone outpace its cool wake. A sharp shear increase around +96 hours then favours a faster decline. Official intensity confidence remains low throughout.
The diagrams show interpolated early-arriving deterministic guidance, distinct from ensemble-density and minimum-pressure products. Forecast lengths differ between models and are preserved as supplied.
Cheers, Patrick Hoareau.
Tropical Cyclone & Weather Monitoring.
A shared initial weakening trend, but different routes around the loop
31 OCTOBER 2026 | 0300 UTC FOCUS
Interpolated early-arriving guidance initialized at 0000 UTC
The black OFCL line represents JTWC warning #31. The upper panel compares forecast tracks; the lower panel compares maximum sustained winds in knots. Both source charts are reproduced in full, with their original legends, forecast-hour labels and credits.
TRACK: THE WESTWARD DEFLECTION STILL SEPARATES THE MODELS
The guidance initially clusters near 23°N before a small clockwise turn and westward deflection. The main split concerns how far west IN-FA travels before turning poleward again. HAFS-A, HWRF and UKMET occupy the western side of the displayed guidance, while ECMWF and the displayed AI solutions generally turn farther east. GFS is particularly progressive northeastward later in the period. The JTWC forecast lies between the eastern and western groups.
The official reasoning reports improved agreement. Excluding the UKMET and UKMET ensemble outliers, the day-five cross-track spread is approximately 537 km, with an along-track spread near 222 km. This qualified spread should not be mistaken for the full range of all guidance. JTWC retains low track confidence throughout, with its forecast between the multi-model and AI consensus but closer to the AI consensus.
The timing of the passing trough, the rebuilding of the western ridge and the subsequent erosion of that ridge determine the loop and eventual northeastward turn. These track differences also affect the ocean heat content encountered, the time spent near the cool wake and exposure to increasing shear.
INTENSITY: WEAKENING FIRST, THEN A SPLIT
All displayed solutions are weaker by +36 hours, although ECMWF allows a small initial increase. After the initial decline, HAFS-A and HWRF show some recovery; ECMWF also maintains a stronger cyclone than OFCL for much of the middle forecast period. In contrast, GFS, DeepMind and WeatherNext broadly favour continued weakening.
The official forecast decreases from 115 kt (130 mph) at 0000 UTC to 110 kt at +12 hours, 105 kt at +24, 95 kt at +36, 90 kt at +48, 85 kt at +60, 80 kt at +72, 75 kt at +96 and 55 kt at +120. The final point is at tropical-storm intensity. The displayed HAFS-A solution recovers toward roughly 105 kt before a sharp decline near day five; HWRF remains around the mid-90 kt range late in its plotted period. These are alternative model scenarios, not equivalent confidence estimates.
JTWC links the initial weakening to lower ocean heat content and slow motion around the loop, with upwelling favouring a steeper decrease between +24 and +36 hours. Faster motion later helps the cyclone outpace its cool wake. A sharp shear increase around +96 hours then favours a faster decline. Official intensity confidence remains low throughout.
The diagrams show interpolated early-arriving deterministic guidance, distinct from ensemble-density and minimum-pressure products. Forecast lengths differ between models and are preserved as supplied.
Cheers, Patrick Hoareau.
Tropical Cyclone & Weather Monitoring.


TYPHOON 30W (IN-FA) — MICROWAVE STRUCTURE
A distinct eye and a compact precipitation ring, with peripheral banding
31 OCTOBER 2026 | 0300 UTC FOCUS
Supplementary passes through 0332 UTC
AMSR3 AT 0332 UTC
The four upper panels show the same GOSAT-GW AMSR3 pass: 36.42 GHz false colour and polarisation-corrected temperature (PCT), followed by 89 GHz horizontal polarisation and PCT. The supplied low-frequency filenames use 37 GHz, while the printed instrument frequency is 36.42 GHz. All original channel labels and scales are preserved.
A well-defined central eye is surrounded by a compact ring, with azimuthal differences and a band extending around the southern side. The higher-frequency imagery highlights the ring and associated ice-scattering structure. A single microwave pass does not establish an eyewall replacement cycle or determine maximum sustained winds.
The lower, centred panel is the simultaneous GPROF surface rain-rate retrieval in mm/h. It depicts an annular precipitation pattern around the relatively dry eye, with uneven rainfall intensity around the ring. These are instantaneous retrieved rates, not accumulated rainfall totals. Each panel must be interpreted with its own scale; colours are not interchangeable between frequencies or products. Black areas outside coverage are missing data.
THE TWO CIMSS CAPTURES
The second planche places the newer pass above the older one. The upper panel is ATMS channel 18 at 183 GHz, valid at 31 October 0327 UTC. The lower panel is SSMIS-16 at 85 GHz, valid at 30 October 221232 UTC, rounded to 2212 UTC in the heading. The full legends are retained.
Both show a distinct central eye and surrounding ring, with peripheral banding. Their different instruments, frequencies and spatial resolutions prevent a direct colour-by-colour comparison. They complement the AMSR3 view but should not be treated as identical measurements separated only by time.
CONTEXT FOR THE FOCUS
JTWC warning #31, issued at 0300 UTC and based on the 0000 UTC analysis, retains 115 kt (130 mph) and 952 hPa. Its reasoning refers to the earlier 2211 UTC SSMIS pass and notes small convective bands on the northern and southern flanks. The new 0327 and 0332 UTC imagery is later supplementary evidence and was not part of that published warning's analysis. It shows that the inner core remains organised, while the official forecast continues to favour weakening around the small clockwise loop and subsequent poleward turn.
Cheers, Patrick Hoareau.
Tropical Cyclone & Weather Monitoring.



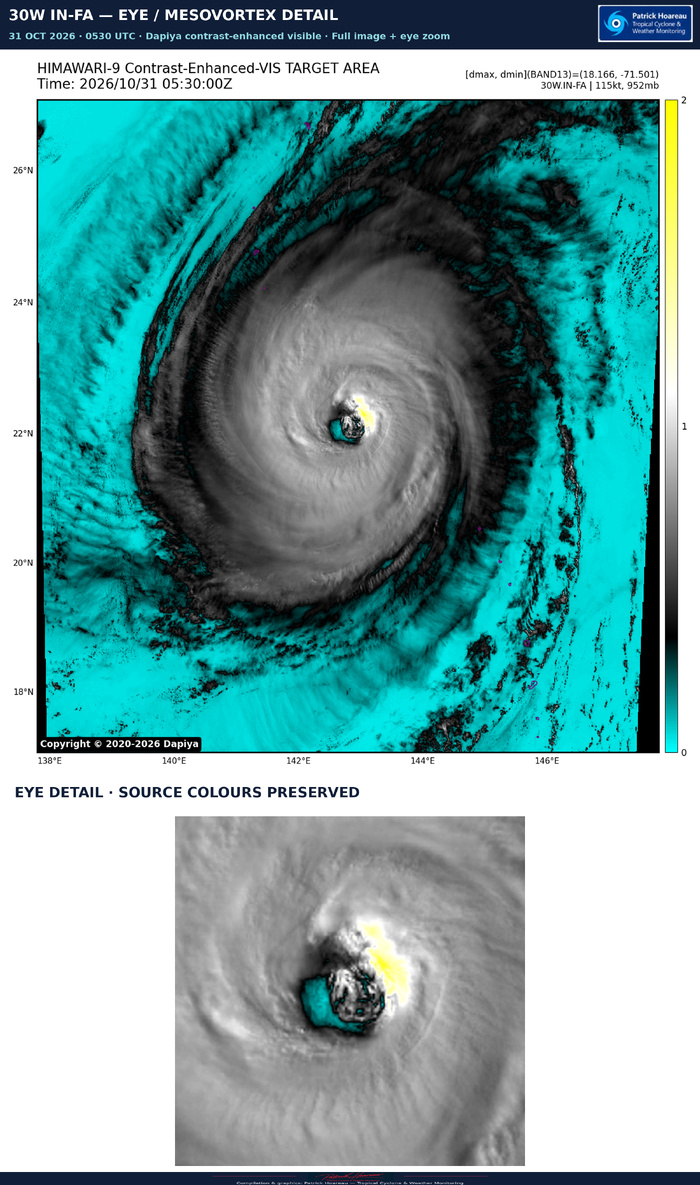
TYPHOON 30W (IN-FA) — SWIRLS WITHIN THE EYE
31 OCTOBER 2026 | 0520 UTC | HIMAWARI-9 VISIBLE
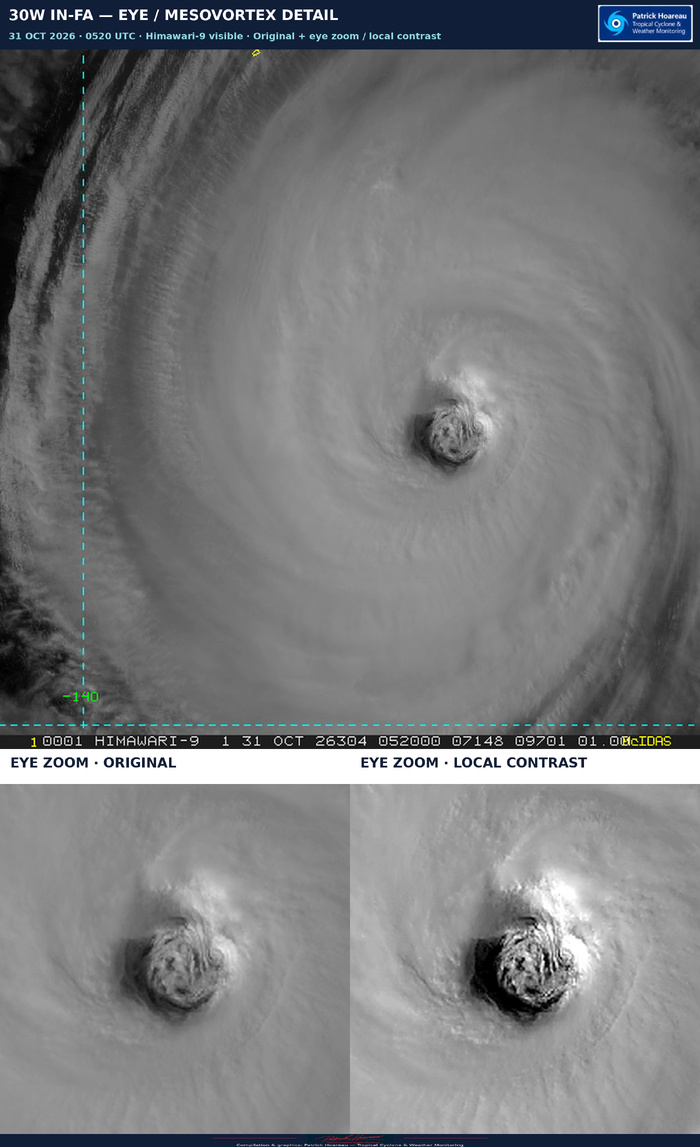
A closer look at IN-FA's eye reveals intricate swirls and filaments in the low clouds. JTWC warning #31 explicitly reports several mesovortices within the roughly 74-km-wide eye.
Mesovortices are smaller rotating circulations embedded within the much larger cyclone. They can develop when the intense ring of rotation near the inner eyewall becomes unstable, concentrating rotation into smaller swirls. These features can move around the eye, interact and merge, stirring air between the eye and eyewall. Low cloud patterns can help make this otherwise invisible airflow visible.
That mixing can redistribute moisture, heat and momentum and influence eyewall convection. Their presence alone does not prove that the typhoon is strengthening: the official analysis remains 115 kt (130 mph) at 0000 UTC, with weakening forecast.
This single visible frame shows cloud texture consistent with the reported complex eye circulation. It cannot establish how many distinct vortices are present, measure their winds or confirm each feature's rotation; a satellite loop is needed to follow their evolution.
The graphic retains the complete original image above. Below are two identical eye crops: the original on the left and moderate local contrast/sharpening on the right. Enlargement makes the existing pixels easier to inspect; it adds no spatial resolution or reconstructed cloud detail.
Sources:
JTWC warning #31 prognostic reasoning, 31 October 2026.
NOAA-hosted research: Kinematic Structure of Mesovortices in the Eyewall of Hurricane Ike (2008) Derived from Ground-Based Dual-Doppler Analysis (2016):
https://repository.library.noaa.gov/view/noaa/65054
Wind Distribution in the Eye of Tropical Cyclone Revealed by a Novel Atmospheric Motion Vector Derivation (2024):
https://repository.library.noaa.gov/view/noaa/68646
Cheers, Patrick Hoareau.
Tropical Cyclone & Weather Monitoring.