

CLICK ON THE IMAGERIES BELOW TO GET THEM ENLARGED



TYPHOON 30W (IN-FA) — US CATEGORY 4
A STILL ROBUST ANNULAR CORE, BUT A WEAKENING TREND AND COMPLEX STEERING AHEAD
2026 OCT 30 0300 UTC | JTWC warning #27 | Analysis: 0000 UTC
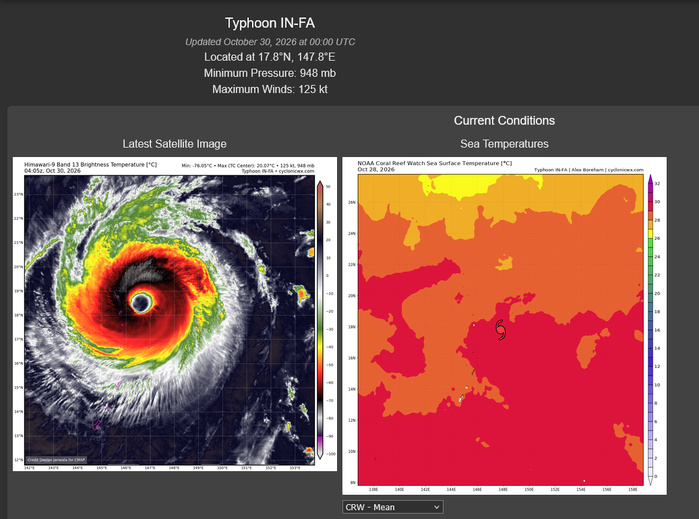
IN-FA is analysed at 125 kt (145 mph), near 17.8°N, 147.8°E, approximately 359 km northeast of Saipan. It has moved west-northwestward at 19 kt, about 35 km/h, over the preceding six hours. The latest JMV retains 130 kt at both 29 October 12Z and 18Z, followed by 125 kt at 30 October 00Z. It is therefore below the JTWC super typhoon threshold while remaining a powerful US category 4 typhoon.
SATELLITE STRUCTURE
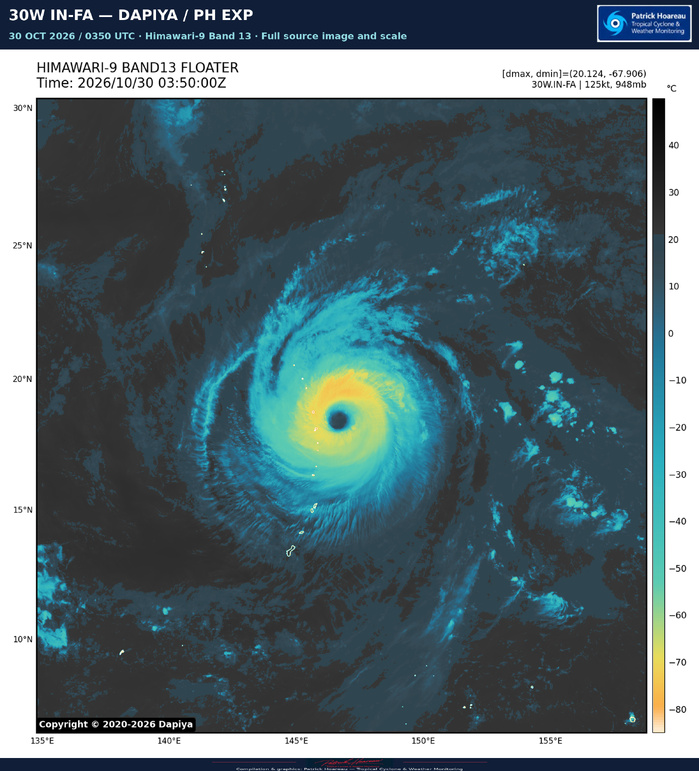
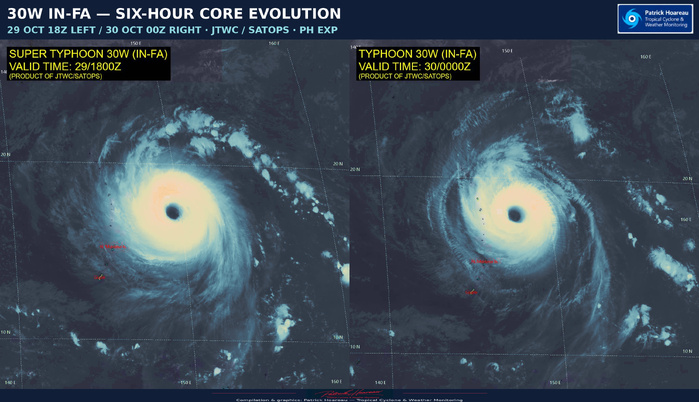
The JTWC describes a still robust but weakening annular cyclone. Cloud tops in the southern quadrant have warmed to approximately −60°C, while the eye has contracted to about 65 km across and its central temperature has warmed by approximately 5°C. These values are from the official reasoning. The 29 October 2003Z microwave pass suggests that the previously near-perfect doughnut structure has begun to degrade.
Our PH EXP comparison shows 29 October 18Z on the left and 30 October 00Z on the right. The large eye remains prominent, while the evolution of the surrounding convective ring provides the more useful context for the weakening assessment. The separate 0350Z Dapiya EXP offers a later view of the core.
The environment remains highly favourable overall: vertical shear of 10–15 kt, sea-surface temperatures of 28–29°C, good ocean heat content and moderate radial outflow. The current wind radii use the 29 October 2247Z ASCAT pass. JTWC confidence is high in position and wind radii, and medium in the initial intensity.
TRACK: A SLOWDOWN, THEN COMPETING RIDGES
IN-FA should continue west-northwestward during the next 12 hours. A trough is expected to weaken the western flank of the ridge to its northeast, allowing the cyclone to approach a steering weakness around +24 hours and slow significantly. Meanwhile, a second ridge to the west should build eastward, creating competing steering between roughly +36 and +60 hours.
Erratic or nearly stationary motion is possible. ECMWF, Google DeepMind and experimental AI guidance allow a temporary northeastward track before looping back west. GFS, NAVGEM, HWRF, UKMET and HAFS-A instead depict a sharp southwestward kink. The smooth official forecast line does not explicitly represent either of those possible short-term deviations.
After +60 hours, the original ridge to the northeast is expected to regain steering authority, carrying the typhoon almost westward through +96 hours. A later trough should then favour a west-northwestward motion. The latitude at which that westward leg begins remains a major uncertainty. The official forecast is closest to the GEFS mean, ECMWF, experimental WindBorne and the AI consensus, with low confidence.
INTENSITY: THE POSITION OF THE SLOWDOWN MATTERS
The official forecast gives 120 kt at +12 and +24 hours, 115 kt at +36 hours, 105 kt at +48 hours, then 95 kt from +60 through +120 hours. The later plateau is US category 2.
Annular characteristics and a favourable environment should limit the initial decline. After +36 hours, slower motion may increase ocean cooling beneath the cyclone, while shear rising towards 25 kt could help introduce dry air into the core.
A sharp ocean-heat-content gradient makes the track especially important. Warmer, deeper water lies just south of the forecast slowdown region, whereas substantially lower ocean heat content lies to the north. A farther-south solution could therefore preserve more intensity; a farther-north track or northeastward excursion could produce greater weakening. The later intensity forecast depends strongly on that steering outcome.
JTWC confidence is low for both track and intensity throughout the five-day forecast. Warnings continue every six hours, with satellite analysis bulletins every three hours.
GRAPHICS
PL1 pairs our PH map of the exact warning #27 forecast coordinates with the 00Z satellite EXP. The supplied PolarWx track-history graphic is paired separately with the official JTWC forecast and is labelled as historical data. It is not a new SST forecast display. Further ensemble comparisons will accompany the incoming model material.
Cheers, Patrick Hoareau.
Tropical Cyclone & Weather Monitoring.

TYPHOON 30W (IN-FA) — INTENSITY FOCUS
2026 OCT 30 0300 UTC | Satellite fix: 0230 UTC
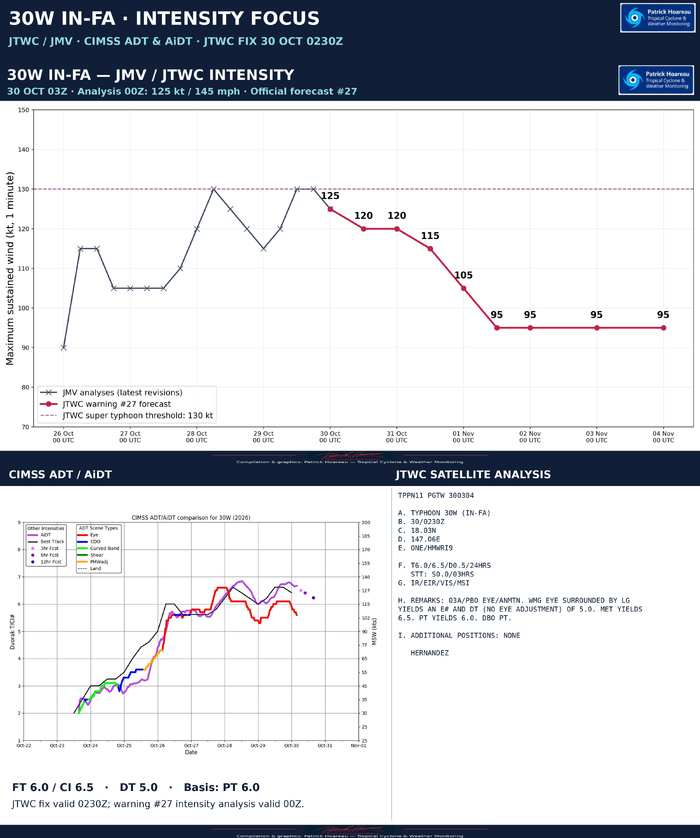
The latest JTWC/JMV analyses retain 130 kt at 29 October 12Z and 18Z, followed by 125 kt at 30 October 00Z. Warning #27 forecasts 120 kt at +12/+24 h, 115 kt at +36 h, 105 kt at +48 h and 95 kt from +60 through +120 h.
The 0230Z satellite fix gives FT 6.0 and CI 6.5, with no change in FT over the preceding three hours. Its +0.5/24 h tendency compares with the previous day; it does not imply renewed strengthening in the last few hours.
The instantaneous eye-pattern DT is lower, at 5.0. A warm medium-grey eye surrounded by light grey yields that value without an eye adjustment. MET is 6.5 and PT is 6.0; the analyst selects PT for the final T-number. The higher CI remains distinct from the lower DT and FT as the assessment responds to weakening.
On the CIMSS panel, the latest ADT eye-pattern curve falls while AiDT remains higher. The purple dots beyond the end of the analysed curve are 3-, 6- and 12-hour forecasts, not subsequent observations. The black line is retained with its original source label, Best Track; our upper chart separately uses the supplied operational JMV revisions.
Taken together, the products show a still powerful typhoon with a weakening satellite pattern. They should be read alongside the official reasoning, which notes warming southern cloud tops and some degradation of the annular microwave structure.
Cheers, Patrick Hoareau.
Tropical Cyclone & Weather Monitoring.



TYPHOON 30W (IN-FA) — JTWC / SIX ENSEMBLES / MODEL INTENSITY
2026 OCT 30 0300 UTC
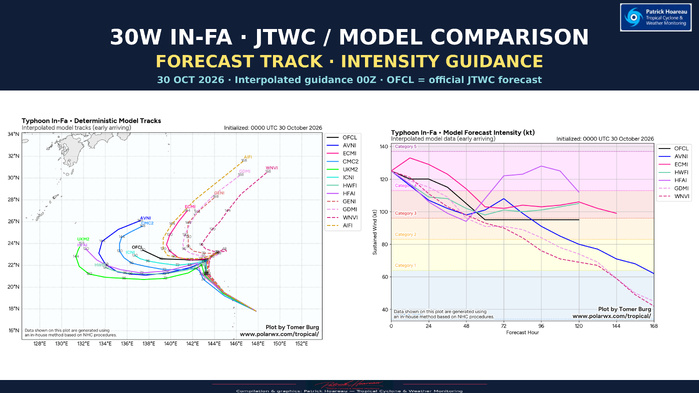
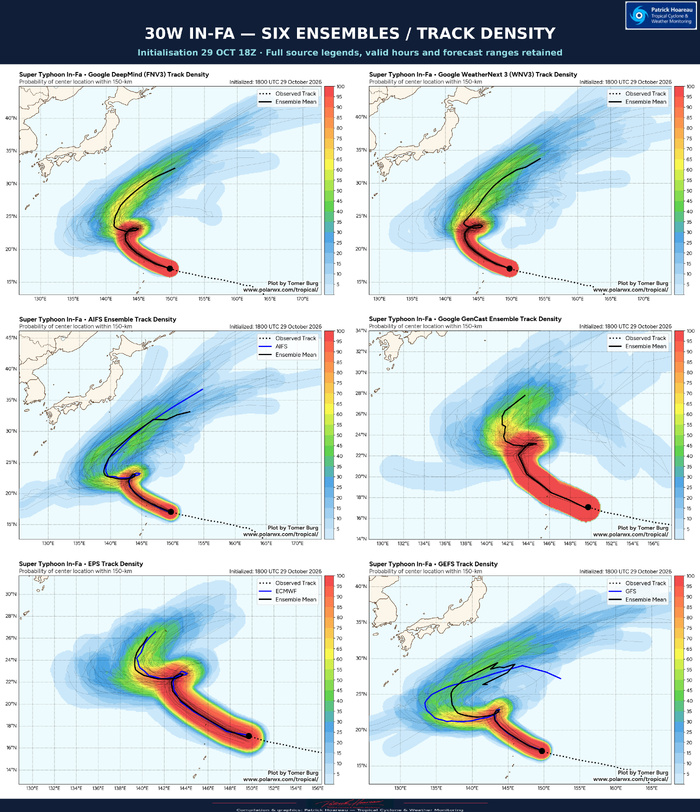
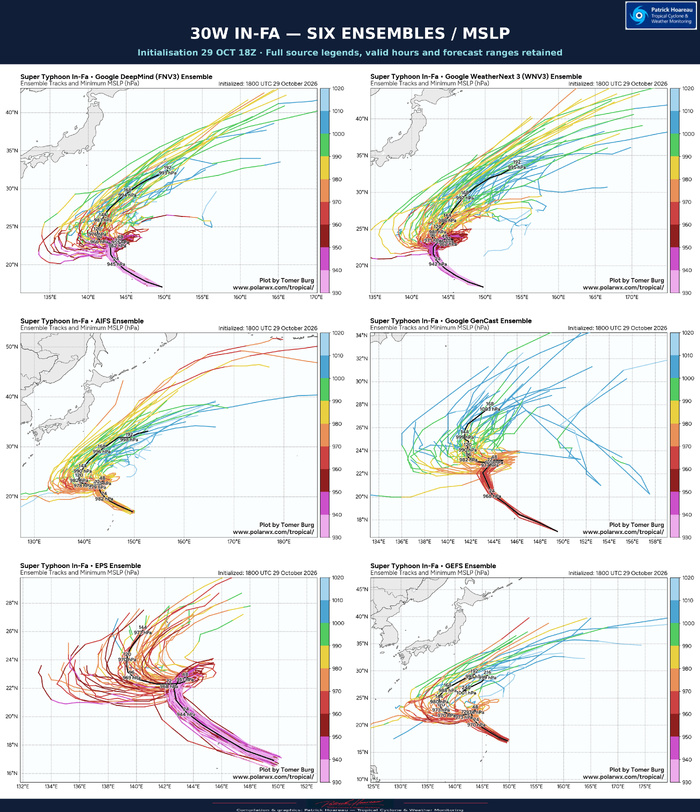
The six ensemble panels use the 29 October 18Z initialisation: Google DeepMind FNV3, WeatherNext 3, AIFS, GenCast, ECMWF EPS and GFS GEFS. The official JTWC warning #27 and the interpolated deterministic track and intensity guidance are referenced to 30 October 00Z. This six-hour cycle difference is retained and labelled.
The common-map PH comparison brings the visible ensemble mean paths together with the exact official JTWC forecast points. Ensemble paths are approximate geographic digitisations from the supplied source charts, not raw model coordinates. Their forecast ranges differ and no matching of forecast hours is inferred along the digitised curves. Use the full source panels for the original forecast-hour labels, member spread and pressure values.
The principal uncertainty concerns the steering transition north of the Mariana Islands. The ensembles share a strong initial northwestward signal before a crowded, slow-moving transition around 22–24°N. Their later mean paths favour a westward bend followed by poleward or northeastward movement, but differ substantially in when and where this occurs. The JTWC retains a longer westward leg within its five-day forecast.
The deterministic guidance exposes a sharper split: ECMWF and AI solutions favour a more poleward outcome after the transition, while several conventional models take the system farther west and south. This agrees with the JTWC reasoning: a temporary northeastward excursion, a stall or a sharp southwestward kink are distinct possibilities that the smooth official line cannot explicitly represent.
For intensity, OFCL is already present on both supplied interpolated charts and represents the official forecast. It starts at 125 kt, gives 120 kt at +12/+24 hours, 115 kt at +36 hours, 105 kt at +48 hours and 95 kt from +60 through +120 hours.
Later intensity solutions diverge strongly. HAFS-A reintensifies towards 130 kt around +96 hours, whereas ECMWF and HWRF retain a typhoon near 100 kt or more around +120 hours. DeepMind and WeatherNext weaken the system more substantially as their tracks turn poleward. The displayed pressure fields on the ensemble charts are not converted to wind speeds.
This is a coupled track–intensity problem. Slower movement may increase upwelling; a farther-north track encounters lower ocean heat content and potentially stronger shear, while a farther-south trajectory may retain access to deeper warm water. JTWC confidence remains low for track and intensity across the forecast.
Full source charts: Tomer Burg / PolarWx. Compilation, PH common-map comparison and presentation: Patrick Hoareau.
Cheers, Patrick Hoareau.
Tropical Cyclone & Weather Monitoring.



TYPHOON 30W (IN-FA) — MICROWAVE STRUCTURE
30 OCTOBER 2026 | GPM/GMI 0250 UTC · Synthetic products 0350 UTC
The first plate assembles six observed GPM/GMI products: surface rain rate, 37 GHz colour and PCT, 89 GHz horizontal polarisation and PCT, and 183 ±3 GHz vertical polarisation. The eye and surrounding precipitation ring are clearly identifiable within the satellite swath. Black areas outside the swath represent missing coverage, not an absence of cloud or rain. Original channel palettes, scales and acquisition labels are retained.
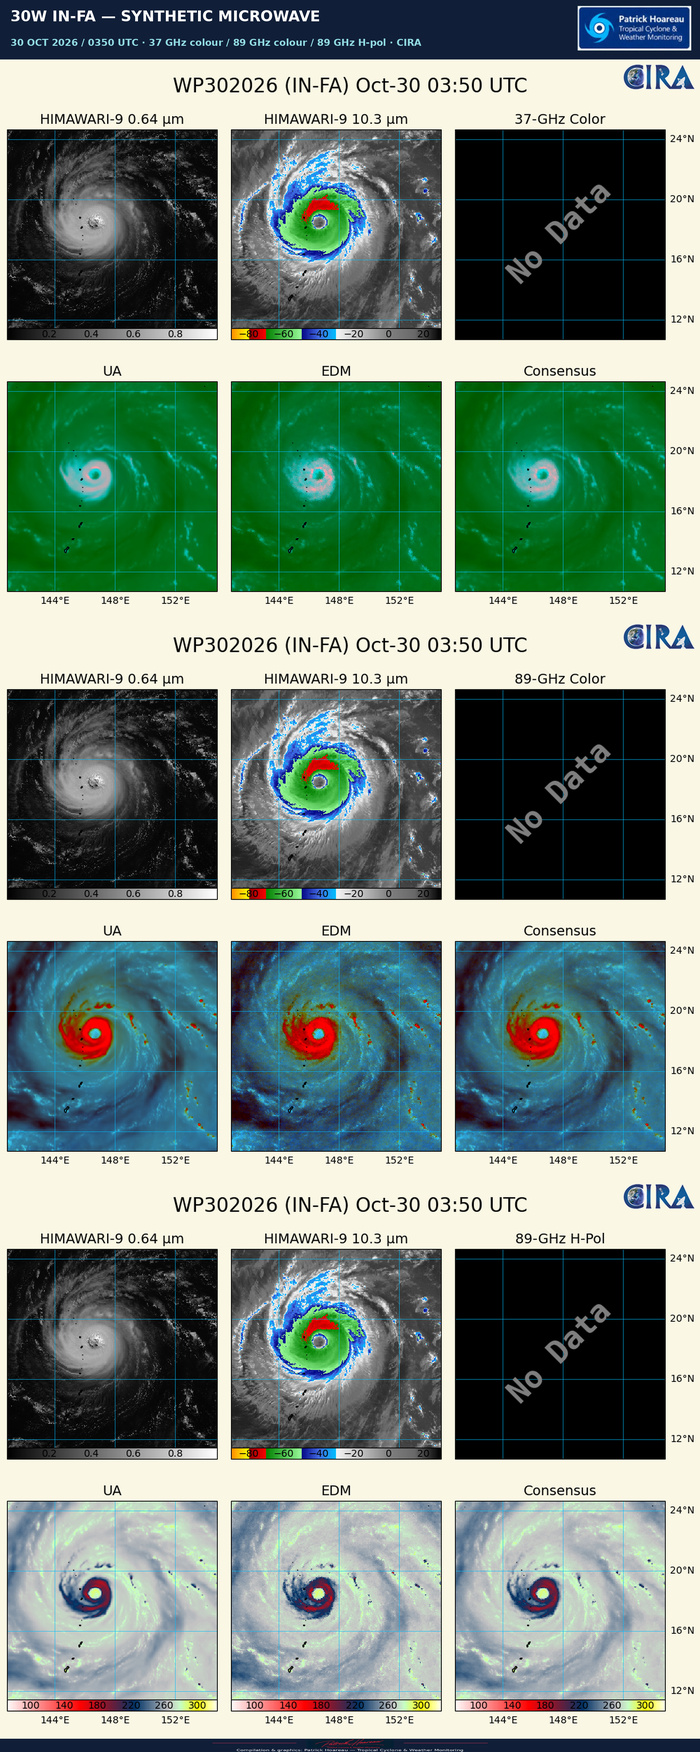
The second plate contains the CIRA synthetic 37 GHz colour, 89 GHz colour and 89 GHz horizontal-polarisation products at 0350 UTC. Their lower panels show machine-learning estimates labelled UA, EDM and Consensus. These are synthetic microwave depictions derived from geostationary imagery, distinct from the direct GPM/GMI observations in the first plate. The source No Data panels are retained.
Together, these views provide complementary perspectives on the core and surrounding precipitation structure at different times. They accompany the 03Z JTWC focus, rather than representing simultaneous observations.
Cheers, Patrick Hoareau.
Tropical Cyclone & Weather Monitoring.


TYPHOON 30W (IN-FA) — ATMOSPHERIC AND OCEANIC ENVIRONMENT
30 OCTOBER 2026 / 0300 UTC FOCUS
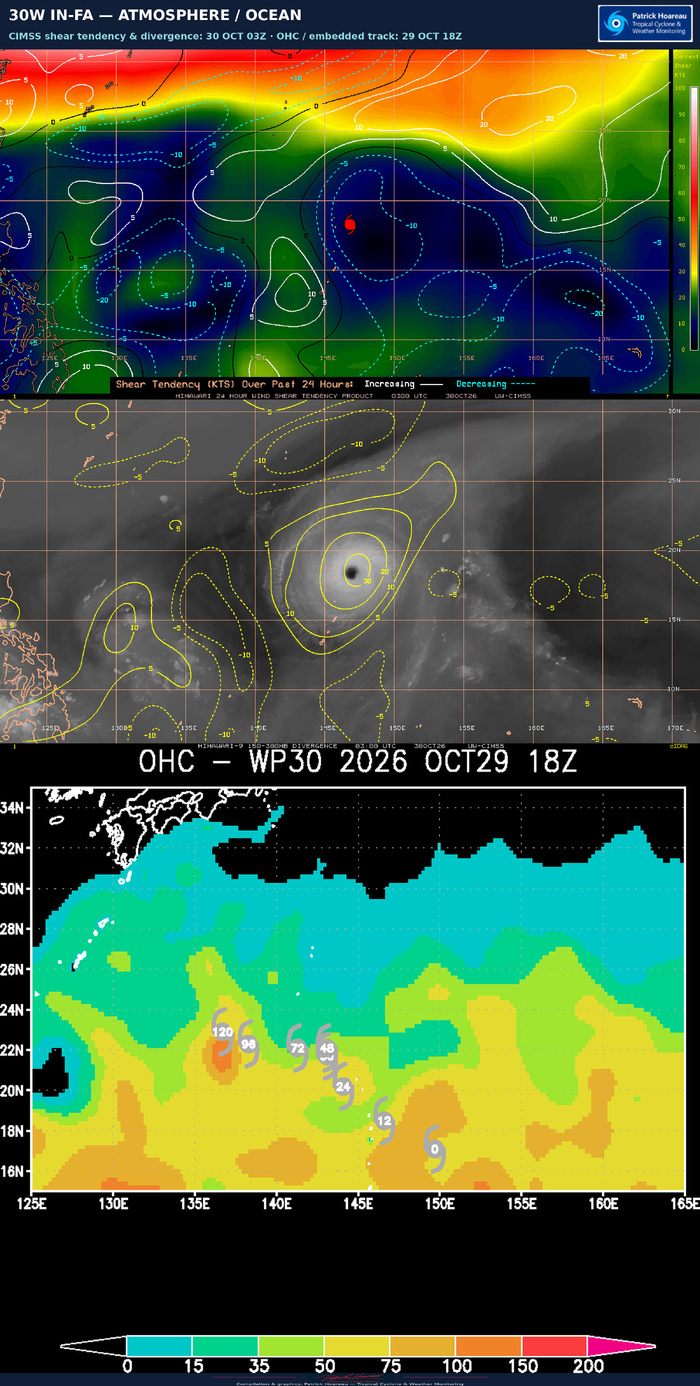
Top: CIMSS current wind-shear magnitude in colours, with contours showing its change over the preceding 24 hours. Solid white contours indicate increasing shear and dashed cyan contours decreasing shear. The current core lies within a relatively low-shear region, with a much stronger shear zone to the north.
Middle: CIMSS 150–300 hPa divergence at 03Z, showing upper-level divergence over the cyclone and its surrounding outflow region.
Bottom: the supplied ocean-heat-content chart, labelled 29 October 18Z. Its embedded forecast track belongs to that earlier cycle, not the latest 03Z warning. The original numerical colour scale is retained; units are not printed on this supplied chart.
These products illustrate the forecast challenge described by the JTWC. A slowdown can increase cooling beneath the cyclone, while the latitude of that slowdown determines access to deeper warm water and exposure to stronger shear. The latest reasoning identifies a sharp ocean-heat-content gradient, with more favourable values south of the forecast transition region and less favourable values north of it.
All source palettes, labels and valid times are retained.
Cheers, Patrick Hoareau.
Tropical Cyclone & Weather Monitoring.