

CLICK ON THE IMAGERIES BELOW TO GET THEM ENLARGED


TYPHOON 30W (IN-FA) — PL1: NORTHERN MARIANA ISLANDS APPROACH, THEN A COMPLEX WESTWARD PIVOT
2026 OCT 29 0300 UTC | JTWC warning #23 | Analysis 0000 UTC
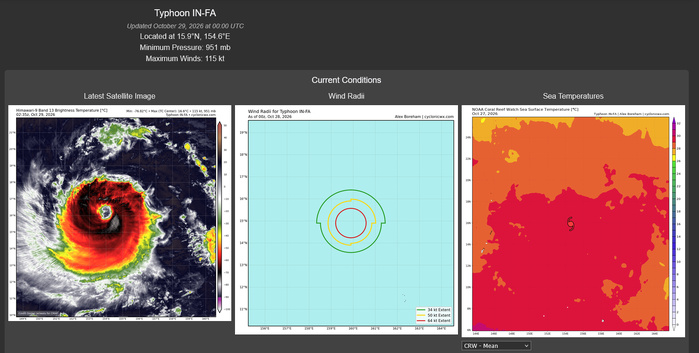
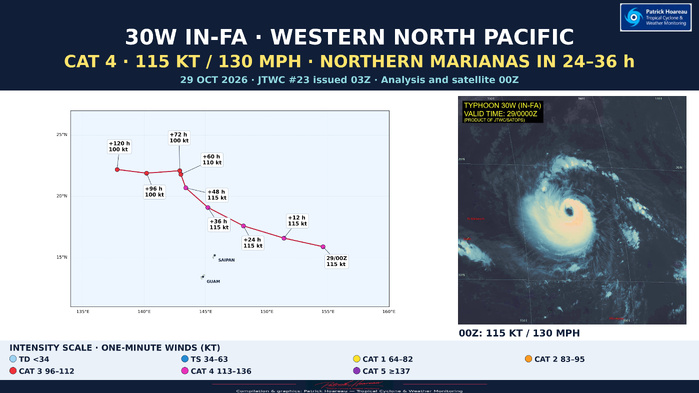
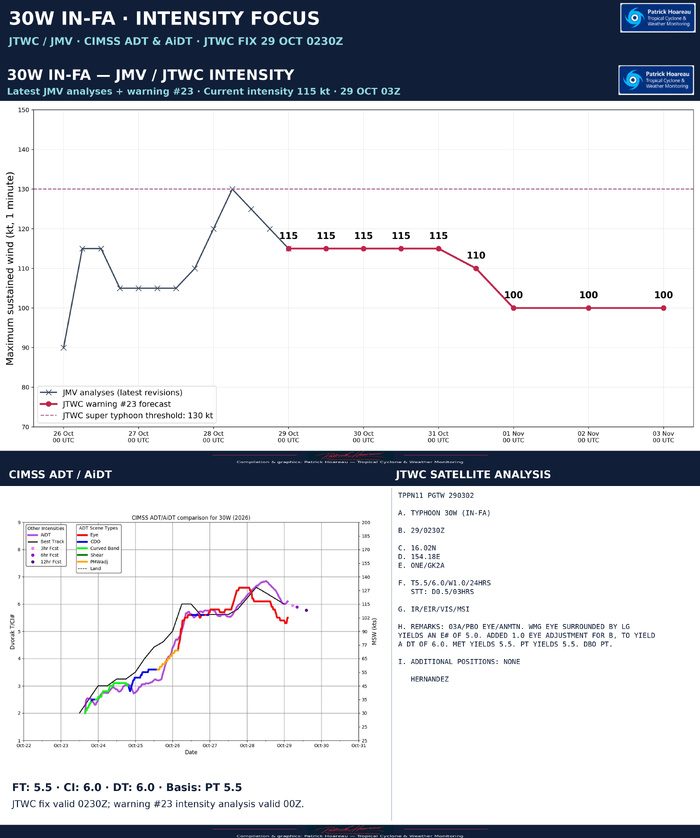
IN-FA is analysed at 115 kt (130 mph), US category 4, near 15.9°N, 154.6°E. It is moving westward at 16 kt, about 30 km/h. The latest JTWC/JMV history shows 130 kt at 28 October 06Z, a revised 125 kt at 12Z, 120 kt at 18Z and 115 kt at 29 October 00Z. The 12Z estimate was previously 130 kt; the new JMV revision is used throughout these graphics.
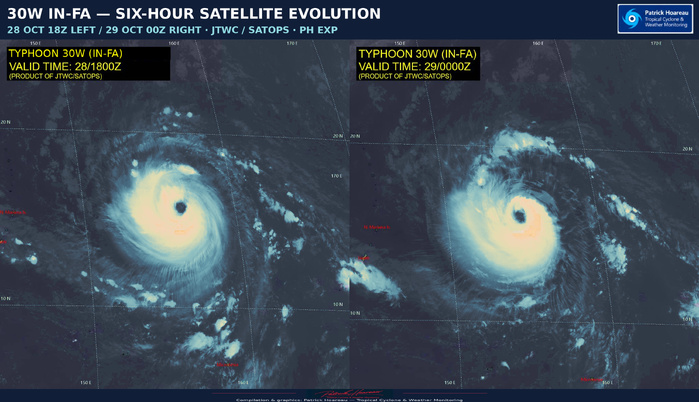
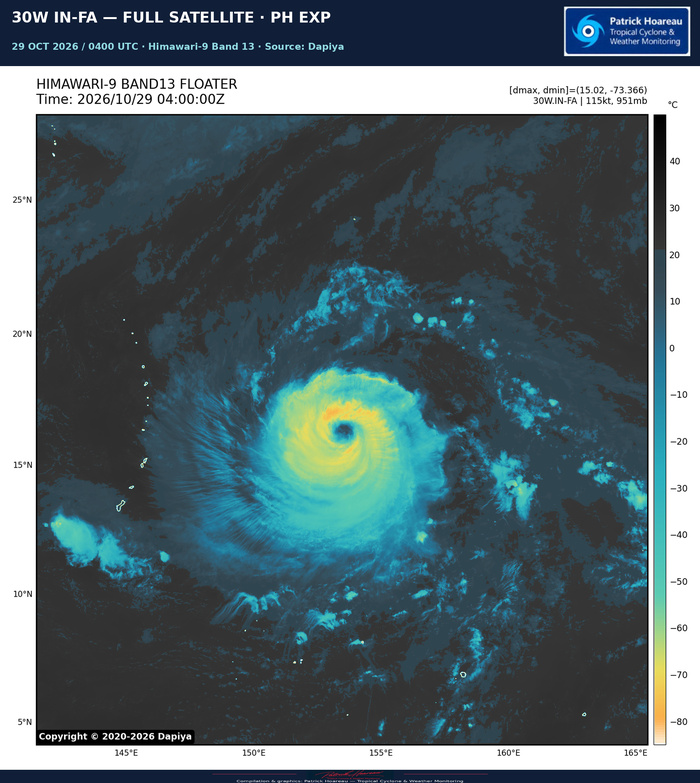
Satellite imagery still shows a quasi-annular structure, limited banding outside the central dense overcast and a large, clear eye approximately 74 km wide. Light to moderate northeasterly shear has disrupted the inner core over the past 12 hours, periodically breaking the northeastern convective ring and concentrating deeper convection towards the west. The latest reasoning notes that deep convection has since rotated back into the upshear sectors, potentially beginning to restore a more symmetrical core. That is a structural possibility, not confirmation of renewed strengthening.
The subtropical ridge to the northeast should steer IN-FA through the northern Mariana Islands region in 24–36 hours. The exact track and wind extent remain important for the islands: neither the centre line nor the forecast category alone defines the whole impact area. JTWC confidence is high in the current position and intensity, but low in the analysed wind radii, which are based on persistence.
The official intensity forecast holds 115 kt through +48 h, averaging over possible short-term fluctuations as the environment remains generally favourable. Vertical shear is expected to ease after about 24 hours. Warm sea-surface temperatures of 29–30°C and strong equatorward outflow provide support.
Between +48 and +72 h, a longwave trough crossing Japan should briefly open a break in the ridge, drawing IN-FA northwestward or northward. The opening is then expected to close as a new ridge builds to the northwest. This blocks further northward progress and favours an abrupt westward pivot south of Iwo To after +72 h. A clockwise-shaped loop is possible, although the official plotted line does not explicitly draw a loop.
Slower movement during the turn could cause upwelling and cooler water beneath the cyclone. The size of that cooling remains uncertain because the forecast track is near a sharp ocean-heat-content gradient. The official intensity forecast eases to 110 kt at +60 h and 100 kt at +72 h, then maintains 100 kt through +120 h. Later model solutions differ between continued weakening as the system broadens and renewed strengthening over warmer water; the JTWC forecast takes an intermediate, near-steady solution.
The track follows the tightly clustered CONW consensus through about +60 h, then leans more towards AI-based guidance during +72 to +120 h. The intensity forecast loosely blends HAFS-A, HWRF and the Google DeepMind ensemble mean. Track confidence is high through +72 h and medium thereafter; intensity confidence is medium throughout.
PL1 combines exact forecast coordinates from the supplied JTWC/JMV file with the 00Z PH EXP satellite image. The paired Facebook satellite graphic shows 28 October 18Z on the left and 29 October 00Z on the right. On the 18Z EXP, the original SATOPS 'SUPER TYPHOON' caption has been changed to 'TYPHOON' to match the latest JMV estimate of 120 kt. The image content, valid time and source attribution are preserved.
Cheers, Patrick Hoareau.
Tropical Cyclone & Weather Monitoring.



TYPHOON 30W (IN-FA) — JTWC / SIX ENSEMBLES
2026 OCT 29 0300 UTC | JTWC warning #23
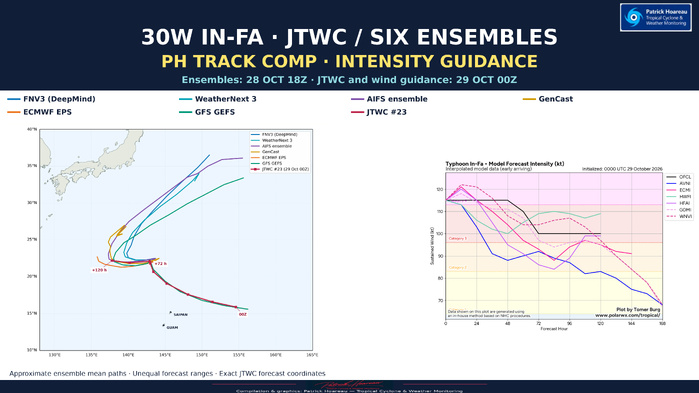
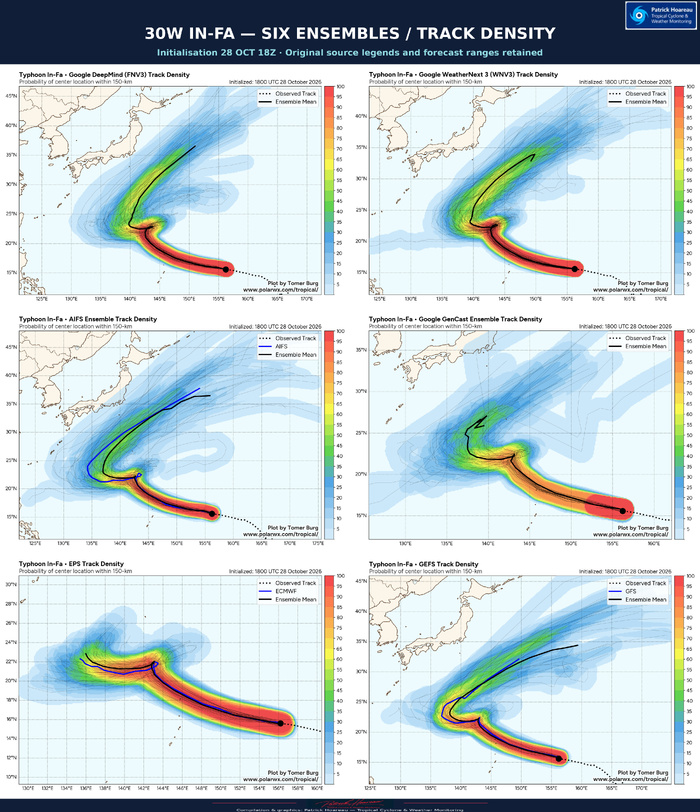
The common-map PH comparison brings together FNV3 (DeepMind), WeatherNext 3, AIFS, GenCast, ECMWF EPS and GFS GEFS, all initialised at 18Z on 28 October. The official JTWC track uses the 00Z analysis on 29 October. This normal six-hour cycle difference is stated on the graphics.
The six means share a west-northwestward approach towards the northern Mariana Islands region, followed by a more poleward turn. The key uncertainty emerges around the low-twenties latitudes: a sharp westward pivot, in some means with a small loop-like feature, precedes markedly different longer-range evolutions. The official forecast anticipates passage through the northern Marianas region in 24–36 hours, a subsequent northwestward turn and an abrupt westward pivot after 72 hours as the ridge rebuilds to the northwest.
Several longer-range ensemble means eventually turn northeastward. Those extensions are not forecasts for the same valid time as the JTWC +120-hour endpoint or the shorter EPS curve. Different forecast ranges are retained on the original plots; endpoints must not be treated as a time-matched comparison. A loop in a mean curve may also reflect differences in timing among members.
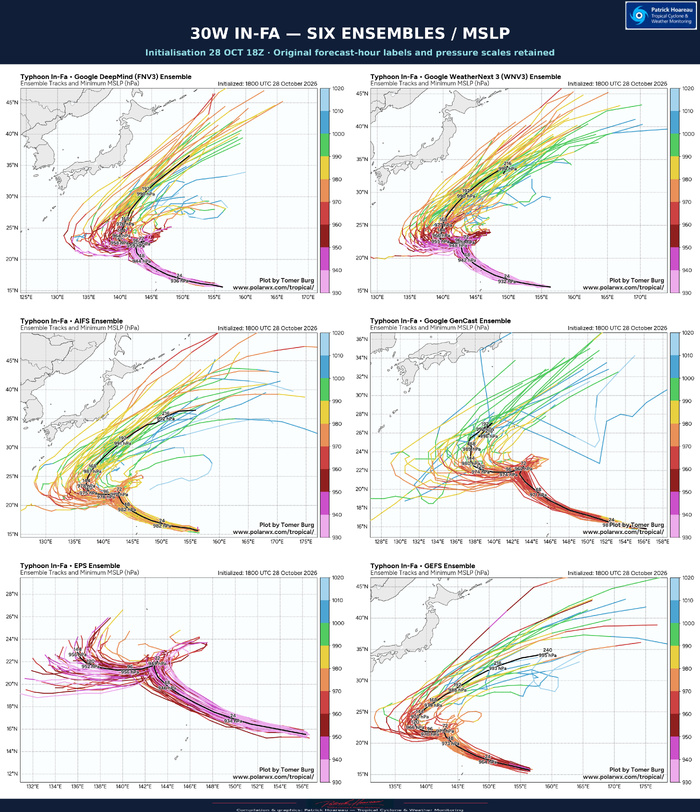
The official forecast stays near the multi-model track consensus through 60 hours and leans towards the AI guidance at 72–120 hours. Its intensity forecast blends HAFS-A, HWRF and the Google DeepMind ensemble mean: 115 kt (130 mph) through 48 hours, 110 kt at 60 hours, then 100 kt (115 mph) at 72–120 hours. The six MSLP panels show central pressure guidance; they are not converted directly into wind categories. The newly supplied interpolated wind guidance is initialised at 00Z on 29 October, matching the official analysis cycle.
INTENSITY GUIDANCE — THE 00Z UPDATE
The official forecast holds 115 kt through +48 hours before easing to 100 kt at +72 hours and maintaining that value through +120 hours. The interpolated model guidance shows appreciable spread around this evolution. WeatherNext 3 (WNVI) and ECMWF (ECMI) initially suggest a small rise above 120 kt, while GFS (AVNI) weakens IN-FA much more quickly. HAFS-A (HFAI) also weakens the system strongly during the middle part of the forecast, before a partial recovery later.
HWRF (HWFI) retains approximately 107–110 kt during +72 to +120 hours, above the official 100 kt plateau. The interpolated DeepMind curve (GDMI) lies below the official line during much of this period; WNVI remains above it around +72 to +108 hours before falling below it near +120 hours. These individual interpolated wind curves are distinct from the ensemble mean tracks and pressure panels. The ECMWF wind curve is no longer the pronounced high outlier seen in the previous 12Z chart.
The attached raw deterministic track chart remains initialised at 18Z on 28 October. It preserves the source labels and lead times; it is not silently relabelled as 00Z guidance.
Method: the coloured ensemble mean curves on the common PH map are approximate geographical tracings of the black curves in the supplied images. They are not raw model coordinates, time-matched forecasts or verification data. JTWC forecast coordinates are read exactly from the supplied warning/JMV data. Original density, MSLP and raw-track plots preserve the source spreads, legends and forecast horizons. Source model graphics: Tomer Burg / PolarWx.
Cheers, Patrick Hoareau.
Tropical Cyclone & Weather Monitoring.




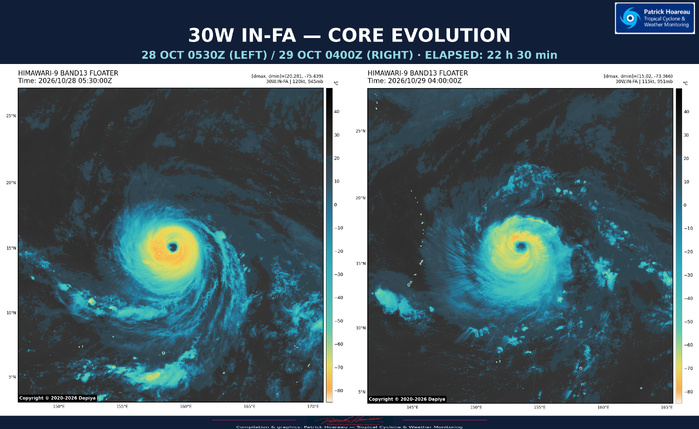
Our PH EXP comparison, spanning 22 hours and 30 minutes, highlights a less intense and less uniform ring of deep convection around the eye. The core remains well defined, but the colder cloud tops formed a more continuous ring yesterday.
Cheers, Patrick Hoareau.
Tropical Cyclone & Weather Monitoring.
Cheers, Patrick Hoareau.
Tropical Cyclone & Weather Monitoring.
