

CLICK ON THE IMAGERIES BELOW TO GET THEM ENLARGED


TYPHOON 30W (IN-FA) — US CATEGORY 4
A ROBUST QUASI-ANNULAR CORE, A COMPLEX LOOP AHEAD AND GRADUAL WEAKENING
30 OCTOBER 2026 | 1500 UTC | JTWC WARNING #29
Analysis and satellite image: 1200 UTC
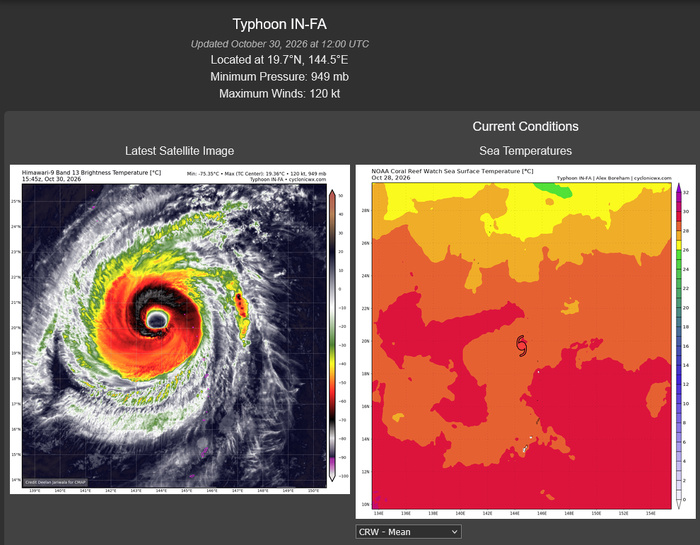
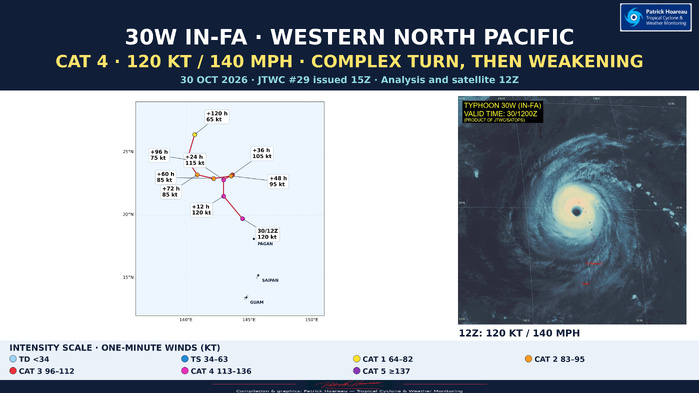
IN-FA remains a powerful US Category 4 typhoon, with maximum sustained one-minute winds of 120 kt (140 mph) and a central pressure of 949 hPa. At 19.7°N, 144.5°E, it is approximately 161 km northwest of Agrihan, moving west-northwestward at 19 kt (about 35 km/h).
A ROBUST, QUASI-ANNULAR CORE
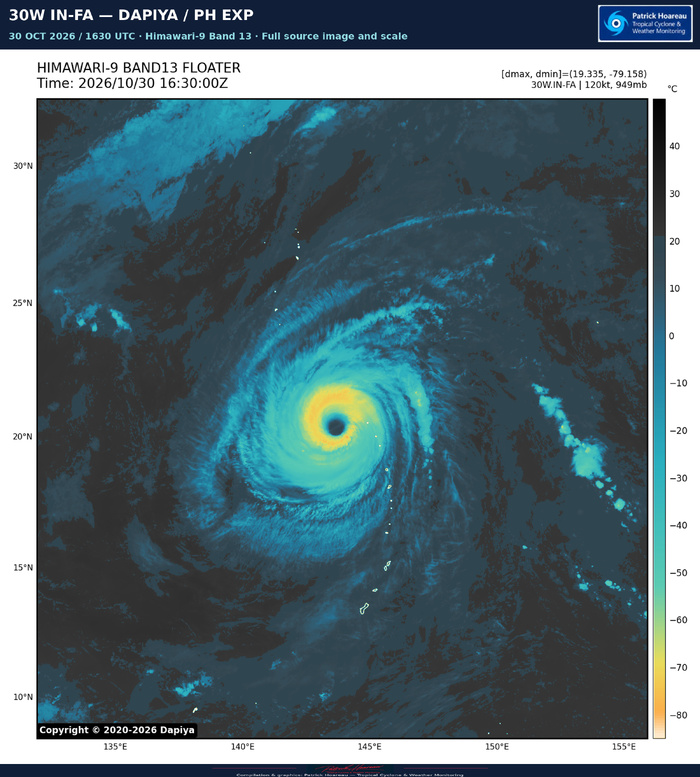
The satellite appearance has changed little over six hours. JTWC reports that average cloud-top temperatures within the central dense overcast have warmed a few degrees, while the roughly 74-km-wide eye has cooled only slightly, to +19°C. The striking stadium effect remains visible in our PH EXP image. A 0640 UTC SSMIS pass supports the quasi-annular assessment, showing a solid convective ring with a small band to the south.
THE SAR CONTRIBUTION
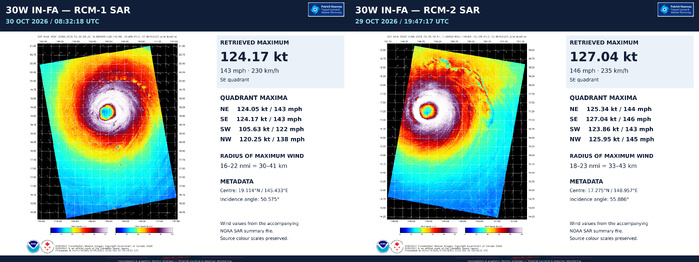
The 0832 UTC RCM-1 SAR pass is explicitly used in the official analysis. JTWC describes maximum winds near 125 kt along the northern and eastern eyewall, with wind radii virtually unchanged from the earlier high-resolution scatterometer data. The accompanying NOAA summary gives quadrant maxima of 124.05 kt NE, 124.17 kt SE, 105.63 kt SW and 120.25 kt NW. Together with recent trends, the SAR supports the JTWC decision to lower the analysed intensity to 120 kt. Initial intensity confidence is medium; position and wind-radii confidence are high.
THE LATEST JMV RECORD
The supplied JMV retains 130 kt at 29 October 12 and 18 UTC, followed by 125 kt at 30 October 00 and 06 UTC and 120 kt at 12 UTC. This is a 10 kt decrease in 18 hours. These operational analyses remain preliminary and subject to revision.
A COMPLEX STEERING SEQUENCE
IN-FA is forecast to turn more northward during the next 12 hours, then slow as it enters a weakness in the subtropical ridge. A short northeastward excursion follows around +24 to +36 hours. As the first trough moves away and the ridge rebuilds, the typhoon bends back westward or west-southwestward. A second trough should allow another poleward turn around +72 hours, followed by a more north-northeastward heading late in the period.
The precise extent of the northeastward excursion is still critical. DeepMind and AIFS take IN-FA farther northeast, leading to an earlier subsequent poleward turn and faster weakening. COAMPS-TC and HAFS-A favour an earlier westward deflection and possible later reintensification. The JTWC track lies near the AI-model mean, closer to DeepMind than HAFS-A. Day-five guidance spread is approximately 982 km: forecast confidence remains low for both track and intensity throughout the period.
INTENSITY OUTLOOK
The official forecast holds 120 kt through +12 hours, then decreases to 115 kt at +24, 105 kt at +36, 95 kt at +48 and 85 kt at +60 and +72 hours. Further weakening to 75 kt at +96 and 65 kt at +120 hours is forecast.
Low shear of 5–10 kt, 29–30°C seas and the quasi-annular structure support short-term persistence. Later, slow motion may promote upwelling, while the trough induces 20–30 kt of mid-level northeasterly shear near +36 hours. Conditions ease around +60 hours, but the subsequent poleward track takes IN-FA toward much lower ocean heat content, favouring renewed weakening.
READING THE GRAPHIC
The left panel shows the exact JTWC forecast positions, coloured by US intensity category, with a large intensity key below. The right panel is our enhanced 1200 UTC JTWC satellite image. Forecast hours are measured from the 1200 UTC analysis, not the 1500 UTC warning issuance.
Cheers, Patrick Hoareau.
Tropical Cyclone & Weather Monitoring.

TYPHOON 30W (IN-FA) — INTENSITY FOCUS
30 OCTOBER 2026 | JTWC WARNING #29
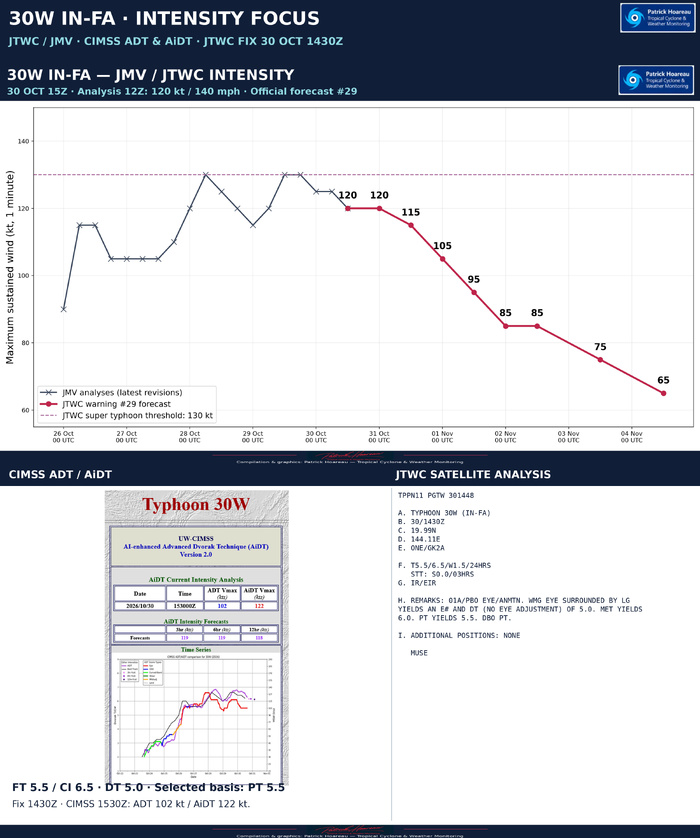
The latest JMV retains 130 kt at 29 October 12 and 18 UTC, followed by 125 kt at 30 October 00 and 06 UTC and 120 kt at 12 UTC. These are preliminary operational analyses, subject to revision.
Warning #29 forecasts 120 kt at +12 hours, 115 kt at +24, 105 kt at +36, 95 kt at +48, 85 kt at +60/+72, 75 kt at +96 and 65 kt at +120 hours. Forecast hours start at 12 UTC. The upper chart separates the latest JMV history from this official forecast.
At 14:30 UTC, the JTWC satellite fix gives FT 5.5 / CI 6.5. The eye-pattern DT is 5.0, without an eye adjustment; MET is 6.0 and PT is 5.5. The analyst selects PT for the final T-number. The FT has not changed over three hours, while its 24-hour tendency is a decrease of 1.5 T-numbers. The higher CI remains distinct from the lower FT and DT during weakening.
At 15:30 UTC, CIMSS reports ADT 102 kt and AiDT 122 kt. The AiDT value is close to the JTWC 12 UTC analysis of 120 kt, although the estimates have different valid times and methods. Its short-range intensity forecasts are 119 kt at +3 and +6 hours and 118 kt at +12 hours; these are forecasts, not observations.
The screenshot is reproduced in full, including its original time-series labels. The source black line labelled Best Track is distinct from the operational JMV history plotted above. The purple forecast points beyond the analysed curve are future estimates.
The official reasoning uses the 08:32 UTC SAR pass and recent trends to support the reduction to 120 kt. A still robust quasi-annular core and low shear support short-term persistence, followed by weakening associated with slower motion, potential upwelling and increased mid-level shear. Track and intensity forecast confidence are low.
Cheers, Patrick Hoareau.
Tropical Cyclone & Weather Monitoring.

TYPHOON 30W (IN-FA) — HOW DOES THE STADIUM EFFECT FORM?
30 OCTOBER 2026 | 0600–1200 UTC
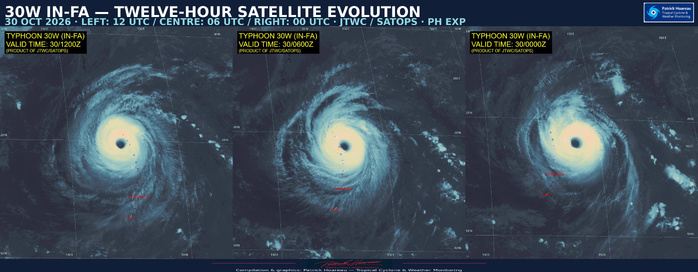
A spectacular view into IN-FA’s eye! But what creates this stadium-like appearance?
Warm, moist air spirals inward near the ocean surface, then rises vigorously in the eyewall. As it ascends, water vapour condenses, releasing heat that helps sustain the towering thunderstorms surrounding the eye.
This rising air also moves outward with height. As it approximately conserves its angular momentum, its rotation slows as it moves farther from the centre. The eyewall therefore slopes outward, making the eye wider aloft than near the surface — much like the seating surrounding a stadium’s playing field.
Meanwhile, sinking air inside the eye warms and dries, helping keep the centre relatively clear. Together, the clear eye and outward-sloping cloud walls create that remarkable impression of depth.
Our two enhanced images and their comparison highlight this structure, particularly striking at 1200 UTC, when IN-FA was assessed at 120 kt (140 mph), US Category 4.
Cheers, Patrick Hoareau.
Tropical Cyclone & Weather Monitoring.
#INFA #30W #StadiumEffect #Typhoon #JTWC #SatelliteImagery

TYPHOON 30W (IN-FA) — MODEL TRACK AND INTENSITY COMPARISON
30 OCTOBER 2026 | 1500 UTC FOCUS
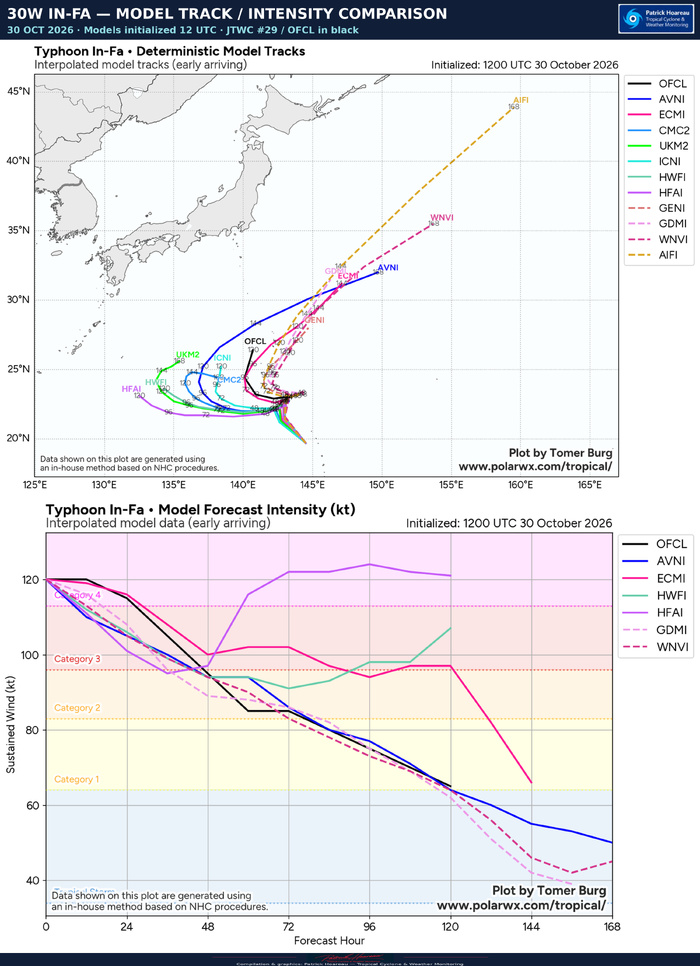
Interpolated early-arriving guidance initialized at 1200 UTC
The black OFCL line on both source charts is the official JTWC forecast from warning #29. The upper panel compares tracks; the lower panel compares maximum sustained winds in knots. Model identifiers and all source legends are retained.
TRACK: THE SIZE OF THE LOOP REMAINS CRITICAL
Guidance is closely grouped initially, then separates as IN-FA slows near 22–23°N. The AI solutions favour a northeastward excursion before a westward deflection and subsequent poleward turn. Several conventional models carry the cyclone farther west before turning north. AIFS is especially progressive toward the northeast later in the period; HAFS-A remains among the westernmost tracks. The JTWC forecast represents an intermediate scenario, closer to the AI-model mean than to the western outliers.
These differences matter because they determine how long IN-FA remains over water cooled by its own slow motion, the ocean heat content along its path, and its exposure to the trough and stronger winds aloft. The official reasoning gives approximately 982 km of guidance spread at day five and low confidence in both track and intensity.
INTENSITY: A SHARED INITIAL DECLINE, THEN A LARGE SPLIT
Most displayed solutions weaken IN-FA during the first 48 hours. Thereafter, HAFS-A diverges sharply, rebuilding to approximately 120–125 kt, while HWRF also recovers later. ECMWF maintains a stronger cyclone than the JTWC late in the period, before weakening further beyond day five. GFS and the displayed DeepMind and WeatherNext guidance favour a more persistent decline.
The official forecast holds 120 kt through +12 hours, then falls to 95 kt at +48, 85 kt at +60/+72 and 65 kt by +120 hours. Its short plateau at +60/+72 hours precedes renewed weakening. The more western HAFS-A scenario offers a different route away from the cold wake and toward potential reintensification; it should be read together with its track, rather than as an isolated intensity prediction.
The diagrams show interpolated early-arriving guidance. They are distinct from the ensemble-density and minimum-pressure products, and their different forecast lengths are preserved.
Cheers, Patrick Hoareau.
Tropical Cyclone & Weather Monitoring.

TYPHOON 30W (IN-FA) — SIX-ENSEMBLE PERSPECTIVE
30 OCTOBER 2026 | 1500 UTC FOCUS
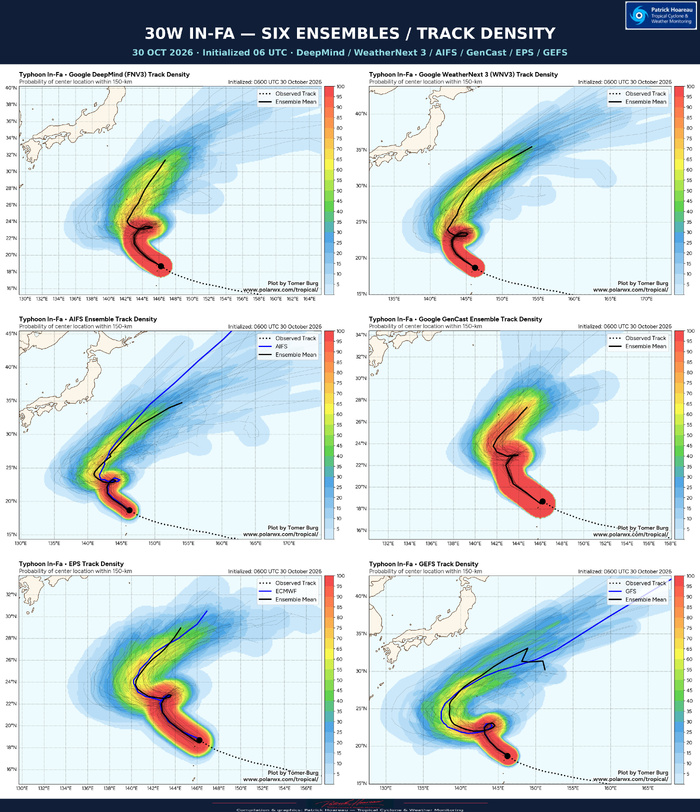
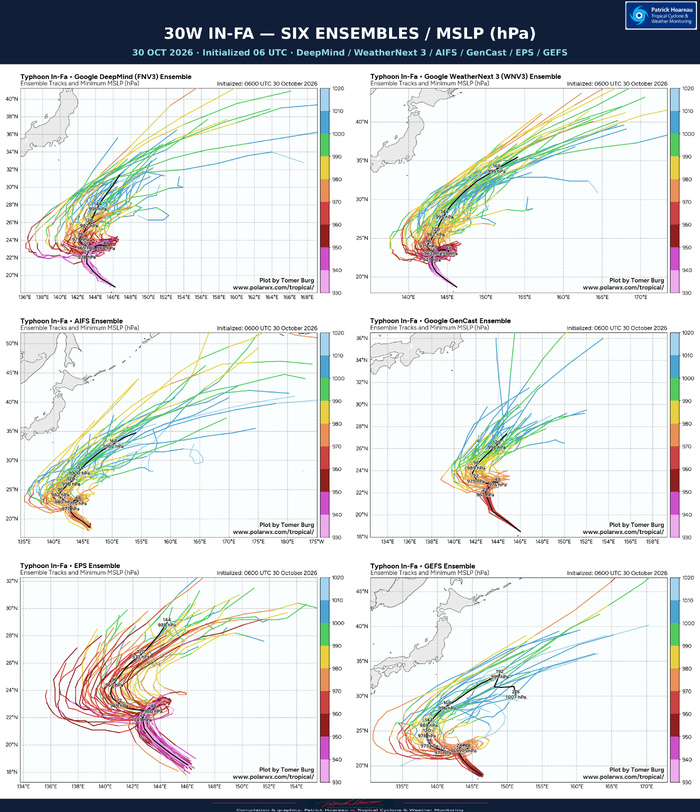
All six supplied ensemble products initialized at 0600 UTC
The panels compare DeepMind FNV3, WeatherNext 3, AIFS, GenCast, ECMWF EPS and GFS GEFS. Their order is identical on both graphics: DeepMind / WeatherNext 3 on the top row, AIFS / GenCast in the middle, EPS / GEFS below. Source labels, legends, scales and forecast ranges are preserved.
A COMMON SEQUENCE, WITH IMPORTANT DIFFERENCES
All six ensemble mean paths show an initially northwestward-to-northward motion, a small northeastward excursion near 22–23°N, a westward deflection, then a renewed poleward turn. The broad sequence is increasingly consistent, but the width of the loop, its timing and the subsequent escape toward the northeast remain uncertain.
GEFS favours a broader westward excursion than the main AI mean tracks. DeepMind and WeatherNext 3 show a relatively compact loop before recurvature, while AIFS also highlights a strong northeastward corridor later. GenCast has a more concentrated later corridor, but its displayed range is shorter. The endpoints therefore do not represent the same forecast hour across all six panels.
The JTWC warning #29, based on the later 1200 UTC analysis and issued at 1500 UTC, lies near the AI-model mean and represents an intermediate scenario between the more northeastward DeepMind/AIFS solutions and the western COAMPS-TC/HAFS-A solutions discussed in its reasoning. Those two latter models are not separate panels in this six-ensemble set. The official forecast is not overlaid on these source charts.
HOW TO READ THE DENSITY MAPS
The colours indicate the probability of the cyclone centre passing within 150 km of a location over the displayed forecast period. They are not probabilities of damaging winds, landfall or simultaneous cyclone presence across the entire shaded area. Thin lines show individual members and black lines show the plotted ensemble mean. Blue lines, where present, show the corresponding deterministic forecast.
PRESSURE: A BROAD WEAKENING SIGNAL
The companion charts colour each member track by minimum sea-level pressure in hPa. The labelled mean paths generally show rising pressure after the early part of the forecast, although starting intensity and the rate of filling differ substantially among the systems. Their pressure values should not be converted directly into equivalent maximum winds.
DeepMind, WeatherNext 3 and EPS retain lower pressures early than AIFS, GEFS and GenCast in these runs. That difference is already visible before the later track divergence, so comparing pressure values alone would mix model representation with forecast evolution.
The physical link remains important: the amount of northeastward travel controls exposure to lower ocean heat content and stronger winds aloft, while the duration of the slow loop controls potential upwelling. These uncertainties help explain why the JTWC retains low confidence in both its track and intensity forecasts.
The ensemble runs start six hours before the warning #29 analysis. Compare forecasts at matching valid times when assessing specific positions or changes; the map shapes alone do not provide a quantitative forecast-error comparison.
Cheers, Patrick Hoareau.
Tropical Cyclone & Weather Monitoring.




TYPHOON 30W (IN-FA) — MICROWAVE STRUCTURE AND WIND FIELD
30 OCTOBER 2026 | 1500 UTC FOCUS
MICROWAVE STRUCTURE
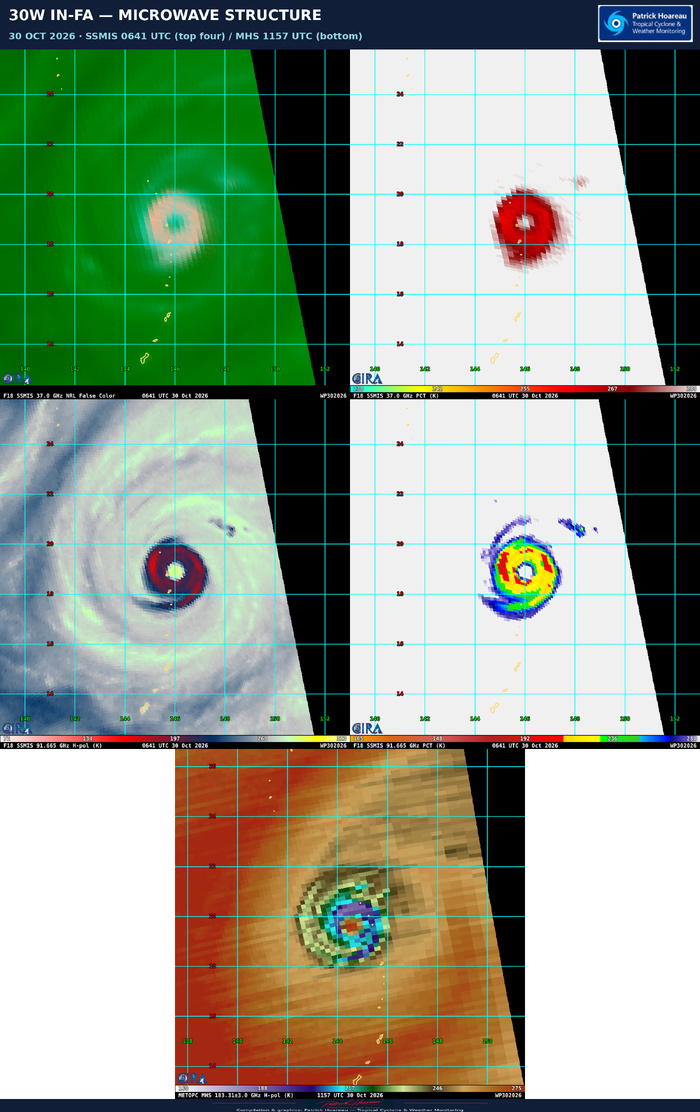
The upper four panels show the same 0641 UTC F18 SSMIS pass: 37 GHz false colour and PCT, followed by 91.665 GHz horizontal polarisation and PCT. The supplied filenames use 89 GHz, but the instrument frequency printed on these SSMIS images is 91.665 GHz. The lower panel is a separate 1157 UTC Metop-C MHS pass at 183.31 ±3.0 GHz, horizontal polarisation. The two passes and channels are distinct; their colours should be interpreted using their own source scales.
The SSMIS imagery reveals a well-defined eye surrounded by a solid convective ring, with some peripheral banding. It complements the quasi-annular structure described in JTWC warning #29, whose reasoning refers to this pass at the rounded time of 0640 UTC. Black areas outside the satellite swath represent missing coverage.
WIND ANALYSIS AND ASCAT
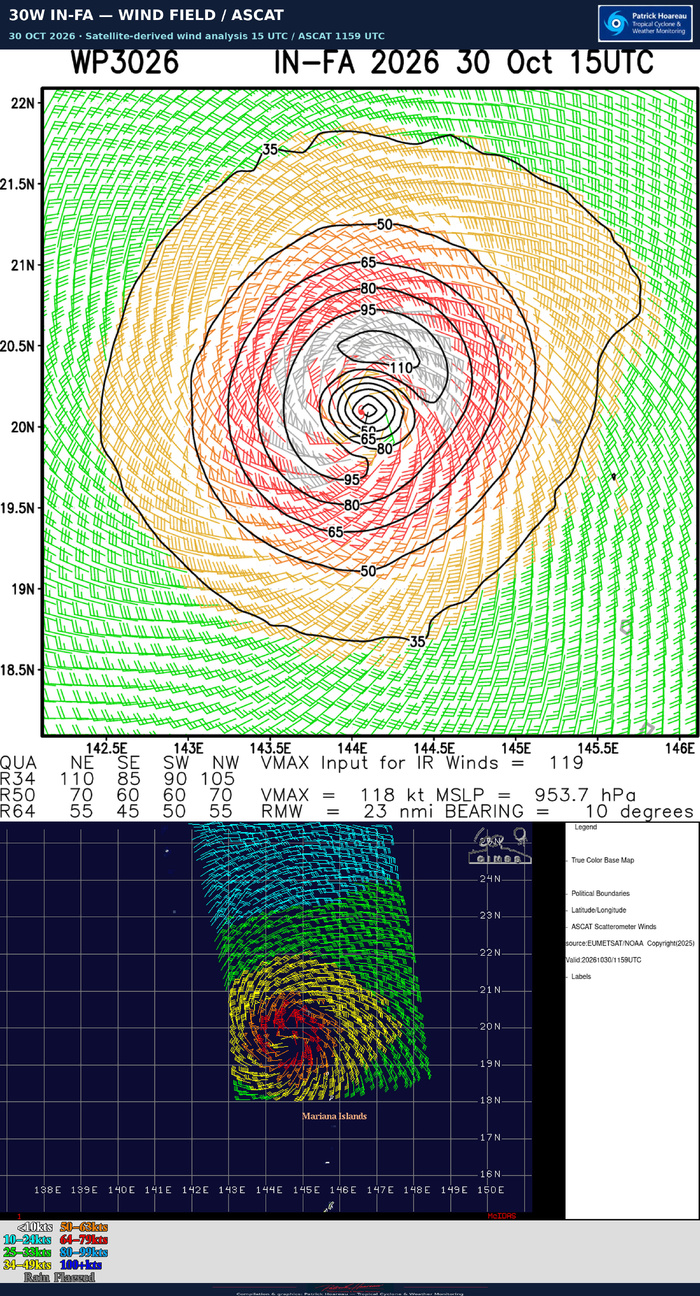
The upper wind panel is the supplied satellite-derived wind analysis valid at 1500 UTC. It prints VMAX 118 kt, MSLP 953.7 hPa and a radius of maximum wind of 23 nautical miles, approximately 43 km. These are values from that analysis product, distinct from the official JTWC 1200 UTC estimate of 120 kt and 949 hPa.
The lower panel shows ASCAT scatterometer winds valid at 1159 UTC. The original wind-speed classes and rain-flag legend are preserved. It provides a complementary view of the circulation and wind-field extent. The ASCAT colour classes do not establish the cyclone's peak eyewall wind, and the two panels have different valid times and methods.
Cheers, Patrick Hoareau.
Tropical Cyclone & Weather Monitoring.