

CLICK ON THE IMAGERIES BELOW TO GET THEM ENLARGED

JTWC PH
JTWC FACEBOOK
Joint Typhoon Warning Center
National Hurricane Center
SOUTHERN HEMISPHERE TROPICAL CYCLONES, 1981–2024
How the season unfolds across the Indian and Pacific oceans
Years ago, I worked through the Southern Hemisphere cyclone records with a small calculator. I wanted to see how the geography of the season changed as it progressed. One pattern stood out. Early-season cyclones were heavily concentrated west of 135°E, while late-season peaks were more widely distributed. My original tables are still available on Australian Severe Weather.
https://www.australiasevereweather.com/cyclones/stats.htm
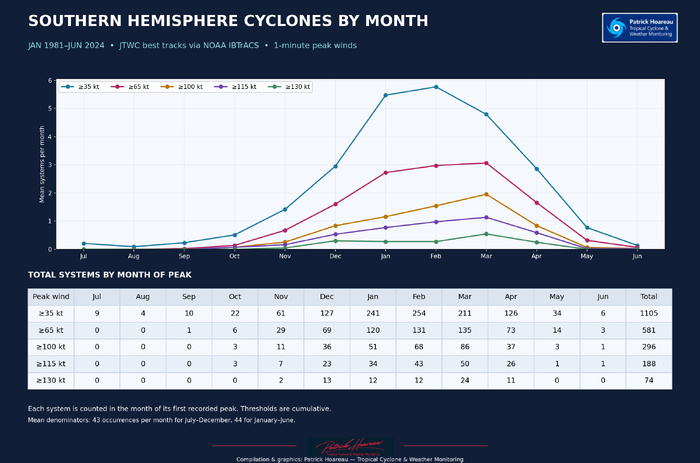
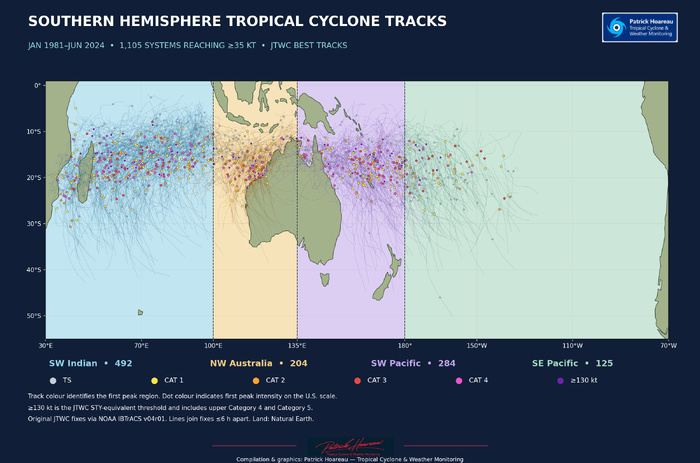
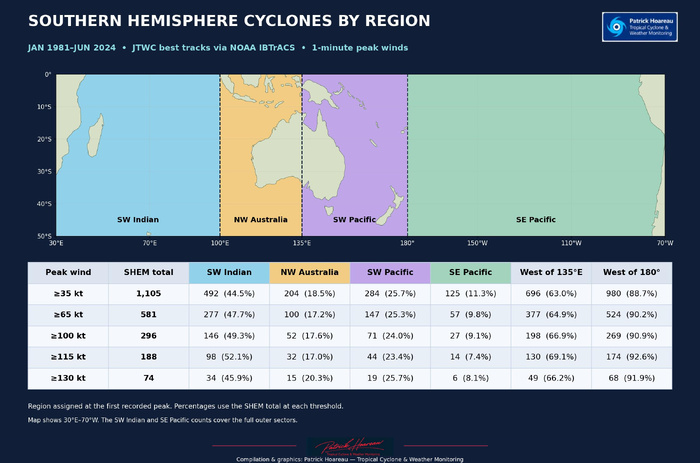
The updated analysis covers January 1981 through June 2024 in the JTWC best-track extract. The last eligible cyclone in that extract peaked in May 2024. It includes 1,105 systems that reached at least 35 kt, of which 581 reached 65 kt, 296 reached 100 kt, 188 reached 115 kt and 74 reached 130 kt. All winds are one-minute sustained estimates. Each cyclone is counted once at the date and location of its first recorded peak. The thresholds are cumulative.
WIND THRESHOLDS USED IN THIS STUDY (1-MINUTE SUSTAINED WINDS)
• ≥35 kt — Tropical storm (TS) threshold used in this study.
• ≥65 kt — U.S. Category 1 intensity or higher.
• ≥100 kt — U.S. Category 3 intensity or higher.
• ≥115 kt — U.S. Category 4 intensity or higher.
• ≥130 kt — JTWC super typhoon (STY) threshold in the western North Pacific. In this Southern Hemisphere analysis, the same wind threshold includes the upper end of U.S. Category 4 and all Category 5 cases. U.S. Category 5 starts at 137 kt.
THE SEASON STARTS WITH A STRONG INDIAN OCEAN BIAS
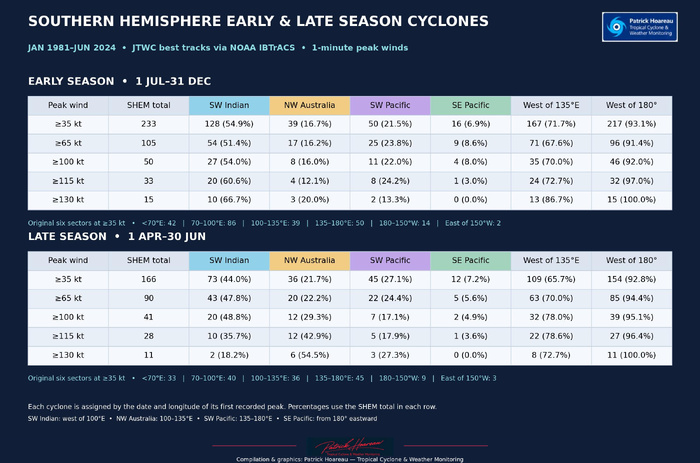
From 1 July to 31 December, 71.7% of cyclones reaching 35 kt peaked west of 135°E. In my original study, the figure was 71.9%. The southwestern Indian Ocean sector, defined here as west of 100°E, accounted for 128 of the 233 early-season systems, or 54.9%, on its own.
The geographic spread was widest during January–March, when the share peaking west of 135°E fell to 59.5%. From 1 April to 30 June, it rose to 65.7%, close to the 64.8% in my original tables. The two analyses cover different periods and use different archive extracts, but they tell much the same story. Early-season activity is concentrated farther west, the core of the season has the largest share of peaks east of 135°E, and the late season settles between the two.
FEBRUARY LEADS AT 35 KT. MARCH LEADS AT HIGHER THRESHOLDS.
February led at ≥35 kt, with 254 systems reaching their peak that month. March led at every higher threshold, from 65 kt through 130 kt. Nearly one in three of the systems that reached 130 kt peaked in March, which accounted for 24 of the 74 cases.
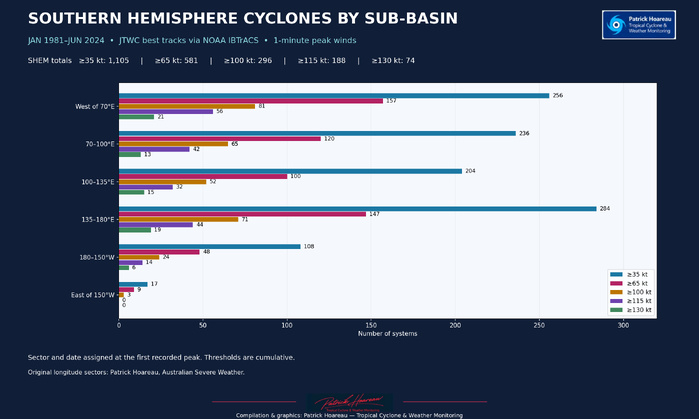
Geography also changes with the threshold. Across the full record, the 135–180°E sector had the most systems at ≥35 kt, with 284. The SW Indian led at each higher threshold. It accounted for 98 of 188 systems at ≥115 kt, just over half the hemisphere total. At ≥130 kt, its share was 34 of 74, or 45.9%.
NORTHWESTERN AUSTRALIA STANDS OUT LATE IN THE SEASON
At ≥130 kt, the SW Indian accounted for 10 of the 15 early-season cases. In April–June, the leading sector shifted to northwestern Australia, between 100°E and 135°E, where six of the 11 late-season systems peaked. The SW Indian still had the most late-season systems at ≥35 kt, but only two reached 130 kt. The sample of extreme late-season cyclones is small, which makes the counts especially important when interpreting the percentages.
EL NIÑO, LA NIÑA AND NEUTRAL CONDITIONS
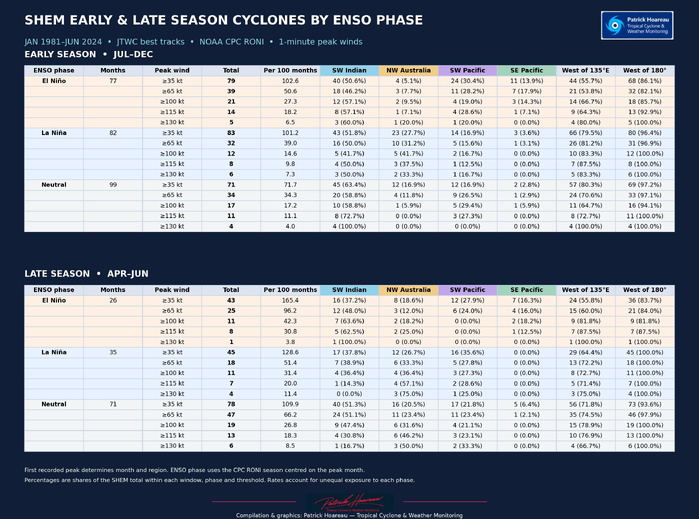
I assigned each cyclone an ENSO phase using the NOAA CPC Relative Oceanic Niño Index (RONI) for the three-month period centred on its peak month. At ≥35 kt, the share of systems peaking in the SW Indian declined from early to late season in all three phases. The distribution farther east differed.
• El Niño. About 44% peaked east of 135°E in both windows. El Niño already had the broadest eastward distribution early in the season. East of 180°, the shares were 13.9% early and 16.3% late, the highest of the three phases in both windows.
• La Niña. The share east of 135°E rose from 20.5% early to 35.6% late, the largest increase of the three phases. In the late-season sample, all those eastern peaks fell in the 135–180°E sector.
• Neutral. The share east of 135°E rose from 19.7% to 28.2%. The SW Indian retained the largest share of peaks of any phase in both windows, with 63.4% early and 51.3% late.
The phases occurred in different numbers of months, so raw counts alone can give a different impression from rates. At ≥35 kt, El Niño had the highest number of systems per 100 months of exposure in both windows, followed by La Niña and then neutral. In El Niño, La Niña and neutral order, the rates were 102.6, 101.2 and 71.7 systems per 100 months in July–December, and 165.4, 128.6 and 109.9 in April–June, using only months through June 2024. At ≥130 kt, individual phase samples are much smaller, so I give more weight to the counts than to the percentage rankings.
WHERE THE SEASON OPENS, AND HOW ENSO AFFECTS THE TWO INDIAN OCEAN SECTORS
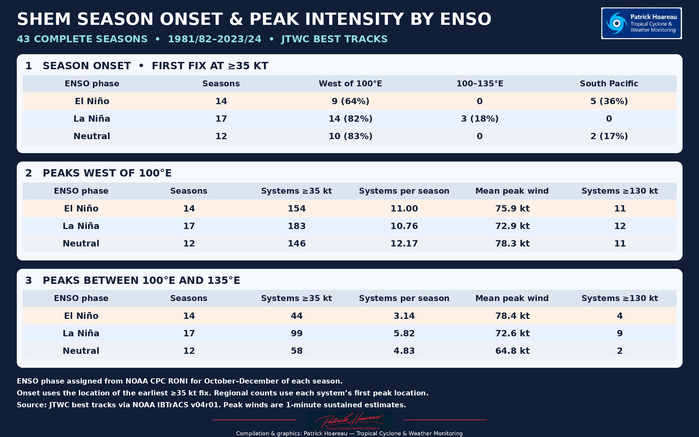
For this comparison I used 43 complete July–June seasons, from 1981/82 to 2023/24, and assigned each season its October–December NOAA CPC RONI phase. I located the opening of each season at the earliest best-track fix at or above 35 kt. That is a different measure from the location of peak intensity.
Ten of the 12 neutral seasons opened west of 100°E, as did 14 of the 17 La Niña seasons and nine of the 14 El Niño seasons. The South Pacific hosted the first system in five El Niño seasons and two neutral seasons. During La Niña, the other three openings were between 100°E and 135°E. A South Pacific start was therefore more common during El Niño, though most El Niño seasons in this record still opened west of 100°E.
West of 100°E, El Niño seasons averaged 11.00 systems reaching 35 kt and a mean peak of 75.9 kt. Both figures were lower than in neutral seasons (12.17 and 78.3 kt) and higher than in La Niña seasons (10.76 and 72.9 kt).
Between 100°E and 135°E, La Niña had the most systems per season (5.82), followed by neutral (4.83) and El Niño (3.14). El Niño had the highest mean peak (78.4 kt), ahead of La Niña (72.6 kt) and neutral (64.8 kt). La Niña still accounted for nine systems at ≥130 kt, compared with four under El Niño and two under neutral conditions. The region and wind statistics in these last two paragraphs use the location of each cyclone’s first peak.
HOW LONG DO CYCLONES STAY ABOVE EACH THRESHOLD?
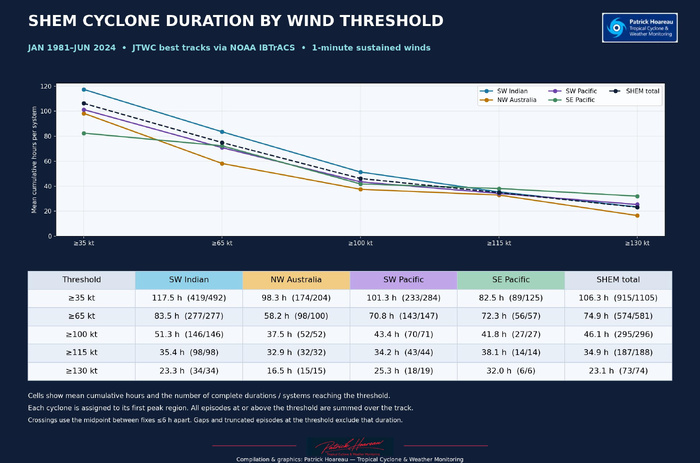
Across the Southern Hemisphere, mean cumulative time per system was 106.3 hours at or above 35 kt, 74.9 at 65 kt, 46.1 at 100 kt, 34.9 at 115 kt and 23.1 at 130 kt. Each mean is calculated among systems that reached that threshold and had a usable duration estimate.
The SW Indian had the longest mean durations at the first three thresholds, with 117.5 hours at ≥35 kt, 83.5 at ≥65 kt and 51.3 at ≥100 kt. The SE Pacific had the longest means at ≥115 kt (38.1 hours across 14 systems) and ≥130 kt (32.0 hours across six systems). At ≥130 kt, the corresponding means were 25.3 hours in the SW Pacific, 23.3 in the SW Indian and 16.5 off NW Australia. The SE Pacific’s small sample makes its mean sensitive to individual storms.
I grouped each system by the region of its first recorded peak and summed all qualifying episodes along its track, including episodes outside that region. Threshold crossings were estimated at the midpoint between fixes no more than six hours apart. Gaps affecting a threshold and episodes truncated at the ends of tracks were excluded. At ≥35 kt, 915 of 1,105 systems had usable duration estimates, compared with 73 of 74 at ≥130 kt. The duration results are grouped by region. The ENSO comparison above describes peak counts and rates.
The result I’m happiest to see is how closely the original early- and late-season shares west of 135°E hold up. The longer record also shows when the eastward spread is greatest and where the strongest late-season systems have tended to peak. Those details are easy to miss in a single hemispheric total.
Sources — JTWC best tracks via NOAA IBTrACS v04r01 and NOAA CPC RONI.
Cheers,
Patrick Hoareau
Tropical Cyclone & Weather Monitoring
JTWC FACEBOOK
Joint Typhoon Warning Center
National Hurricane Center
SOUTHERN HEMISPHERE TROPICAL CYCLONES, 1981–2024
How the season unfolds across the Indian and Pacific oceans
Years ago, I worked through the Southern Hemisphere cyclone records with a small calculator. I wanted to see how the geography of the season changed as it progressed. One pattern stood out. Early-season cyclones were heavily concentrated west of 135°E, while late-season peaks were more widely distributed. My original tables are still available on Australian Severe Weather.
https://www.australiasevereweather.com/cyclones/stats.htm
The updated analysis covers January 1981 through June 2024 in the JTWC best-track extract. The last eligible cyclone in that extract peaked in May 2024. It includes 1,105 systems that reached at least 35 kt, of which 581 reached 65 kt, 296 reached 100 kt, 188 reached 115 kt and 74 reached 130 kt. All winds are one-minute sustained estimates. Each cyclone is counted once at the date and location of its first recorded peak. The thresholds are cumulative.
WIND THRESHOLDS USED IN THIS STUDY (1-MINUTE SUSTAINED WINDS)
• ≥35 kt — Tropical storm (TS) threshold used in this study.
• ≥65 kt — U.S. Category 1 intensity or higher.
• ≥100 kt — U.S. Category 3 intensity or higher.
• ≥115 kt — U.S. Category 4 intensity or higher.
• ≥130 kt — JTWC super typhoon (STY) threshold in the western North Pacific. In this Southern Hemisphere analysis, the same wind threshold includes the upper end of U.S. Category 4 and all Category 5 cases. U.S. Category 5 starts at 137 kt.
THE SEASON STARTS WITH A STRONG INDIAN OCEAN BIAS
From 1 July to 31 December, 71.7% of cyclones reaching 35 kt peaked west of 135°E. In my original study, the figure was 71.9%. The southwestern Indian Ocean sector, defined here as west of 100°E, accounted for 128 of the 233 early-season systems, or 54.9%, on its own.
The geographic spread was widest during January–March, when the share peaking west of 135°E fell to 59.5%. From 1 April to 30 June, it rose to 65.7%, close to the 64.8% in my original tables. The two analyses cover different periods and use different archive extracts, but they tell much the same story. Early-season activity is concentrated farther west, the core of the season has the largest share of peaks east of 135°E, and the late season settles between the two.
FEBRUARY LEADS AT 35 KT. MARCH LEADS AT HIGHER THRESHOLDS.
February led at ≥35 kt, with 254 systems reaching their peak that month. March led at every higher threshold, from 65 kt through 130 kt. Nearly one in three of the systems that reached 130 kt peaked in March, which accounted for 24 of the 74 cases.
Geography also changes with the threshold. Across the full record, the 135–180°E sector had the most systems at ≥35 kt, with 284. The SW Indian led at each higher threshold. It accounted for 98 of 188 systems at ≥115 kt, just over half the hemisphere total. At ≥130 kt, its share was 34 of 74, or 45.9%.
NORTHWESTERN AUSTRALIA STANDS OUT LATE IN THE SEASON
At ≥130 kt, the SW Indian accounted for 10 of the 15 early-season cases. In April–June, the leading sector shifted to northwestern Australia, between 100°E and 135°E, where six of the 11 late-season systems peaked. The SW Indian still had the most late-season systems at ≥35 kt, but only two reached 130 kt. The sample of extreme late-season cyclones is small, which makes the counts especially important when interpreting the percentages.
EL NIÑO, LA NIÑA AND NEUTRAL CONDITIONS
I assigned each cyclone an ENSO phase using the NOAA CPC Relative Oceanic Niño Index (RONI) for the three-month period centred on its peak month. At ≥35 kt, the share of systems peaking in the SW Indian declined from early to late season in all three phases. The distribution farther east differed.
• El Niño. About 44% peaked east of 135°E in both windows. El Niño already had the broadest eastward distribution early in the season. East of 180°, the shares were 13.9% early and 16.3% late, the highest of the three phases in both windows.
• La Niña. The share east of 135°E rose from 20.5% early to 35.6% late, the largest increase of the three phases. In the late-season sample, all those eastern peaks fell in the 135–180°E sector.
• Neutral. The share east of 135°E rose from 19.7% to 28.2%. The SW Indian retained the largest share of peaks of any phase in both windows, with 63.4% early and 51.3% late.
The phases occurred in different numbers of months, so raw counts alone can give a different impression from rates. At ≥35 kt, El Niño had the highest number of systems per 100 months of exposure in both windows, followed by La Niña and then neutral. In El Niño, La Niña and neutral order, the rates were 102.6, 101.2 and 71.7 systems per 100 months in July–December, and 165.4, 128.6 and 109.9 in April–June, using only months through June 2024. At ≥130 kt, individual phase samples are much smaller, so I give more weight to the counts than to the percentage rankings.
WHERE THE SEASON OPENS, AND HOW ENSO AFFECTS THE TWO INDIAN OCEAN SECTORS
For this comparison I used 43 complete July–June seasons, from 1981/82 to 2023/24, and assigned each season its October–December NOAA CPC RONI phase. I located the opening of each season at the earliest best-track fix at or above 35 kt. That is a different measure from the location of peak intensity.
Ten of the 12 neutral seasons opened west of 100°E, as did 14 of the 17 La Niña seasons and nine of the 14 El Niño seasons. The South Pacific hosted the first system in five El Niño seasons and two neutral seasons. During La Niña, the other three openings were between 100°E and 135°E. A South Pacific start was therefore more common during El Niño, though most El Niño seasons in this record still opened west of 100°E.
West of 100°E, El Niño seasons averaged 11.00 systems reaching 35 kt and a mean peak of 75.9 kt. Both figures were lower than in neutral seasons (12.17 and 78.3 kt) and higher than in La Niña seasons (10.76 and 72.9 kt).
Between 100°E and 135°E, La Niña had the most systems per season (5.82), followed by neutral (4.83) and El Niño (3.14). El Niño had the highest mean peak (78.4 kt), ahead of La Niña (72.6 kt) and neutral (64.8 kt). La Niña still accounted for nine systems at ≥130 kt, compared with four under El Niño and two under neutral conditions. The region and wind statistics in these last two paragraphs use the location of each cyclone’s first peak.
HOW LONG DO CYCLONES STAY ABOVE EACH THRESHOLD?
Across the Southern Hemisphere, mean cumulative time per system was 106.3 hours at or above 35 kt, 74.9 at 65 kt, 46.1 at 100 kt, 34.9 at 115 kt and 23.1 at 130 kt. Each mean is calculated among systems that reached that threshold and had a usable duration estimate.
The SW Indian had the longest mean durations at the first three thresholds, with 117.5 hours at ≥35 kt, 83.5 at ≥65 kt and 51.3 at ≥100 kt. The SE Pacific had the longest means at ≥115 kt (38.1 hours across 14 systems) and ≥130 kt (32.0 hours across six systems). At ≥130 kt, the corresponding means were 25.3 hours in the SW Pacific, 23.3 in the SW Indian and 16.5 off NW Australia. The SE Pacific’s small sample makes its mean sensitive to individual storms.
I grouped each system by the region of its first recorded peak and summed all qualifying episodes along its track, including episodes outside that region. Threshold crossings were estimated at the midpoint between fixes no more than six hours apart. Gaps affecting a threshold and episodes truncated at the ends of tracks were excluded. At ≥35 kt, 915 of 1,105 systems had usable duration estimates, compared with 73 of 74 at ≥130 kt. The duration results are grouped by region. The ENSO comparison above describes peak counts and rates.
The result I’m happiest to see is how closely the original early- and late-season shares west of 135°E hold up. The longer record also shows when the eastward spread is greatest and where the strongest late-season systems have tended to peak. Those details are easy to miss in a single hemispheric total.
Sources — JTWC best tracks via NOAA IBTrACS v04r01 and NOAA CPC RONI.
Cheers,
Patrick Hoareau
Tropical Cyclone & Weather Monitoring