

CLICK ON THE IMAGERIES BELOW TO GET THEM ENLARGED


SUPER TYPHOON 30W (IN-FA) — US CATEGORY 4
A STRENGTHENING ANNULAR-TYPE CORE, FOLLOWED BY A COMPLEX STEERING TRANSITION
2026 OCT 29 1500 UTC | JTWC warning #25 | Analysis: 1200 UTC
Additional satellite analysis: 1430 UTC
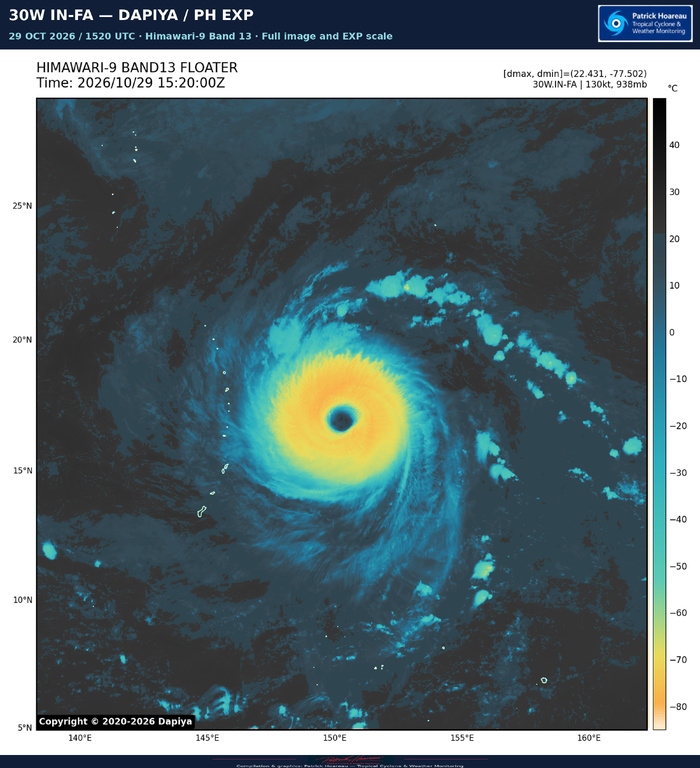
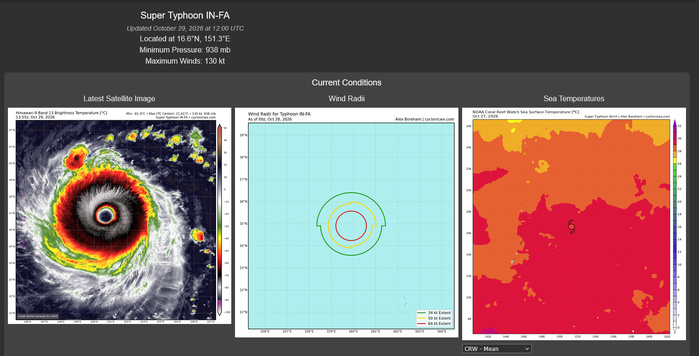
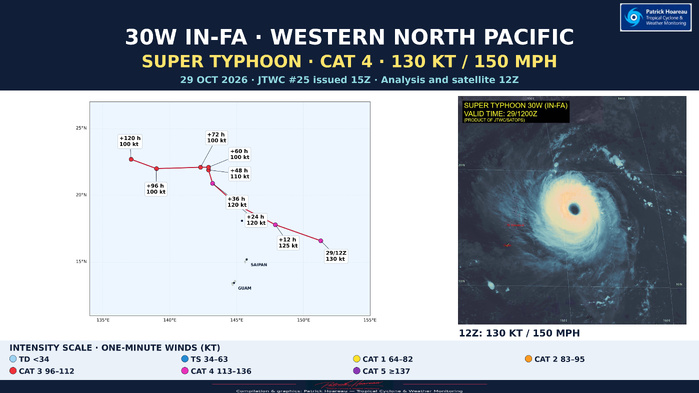
IN-FA has returned to super typhoon intensity. The JTWC analyses one-minute sustained winds of 130 kt (150 mph) at 12Z, near 16.6°N, 151.3°E — approximately 610 km east-northeast of Saipan. Its westward motion over the preceding six hours was 16 kt, about 30 km/h. The latest supplied JMV record gives 115 kt at 00Z, 120 kt at 06Z and 130 kt at 12Z.
A CORE THAT HAS BECOME INCREASINGLY IMPRESSIVE
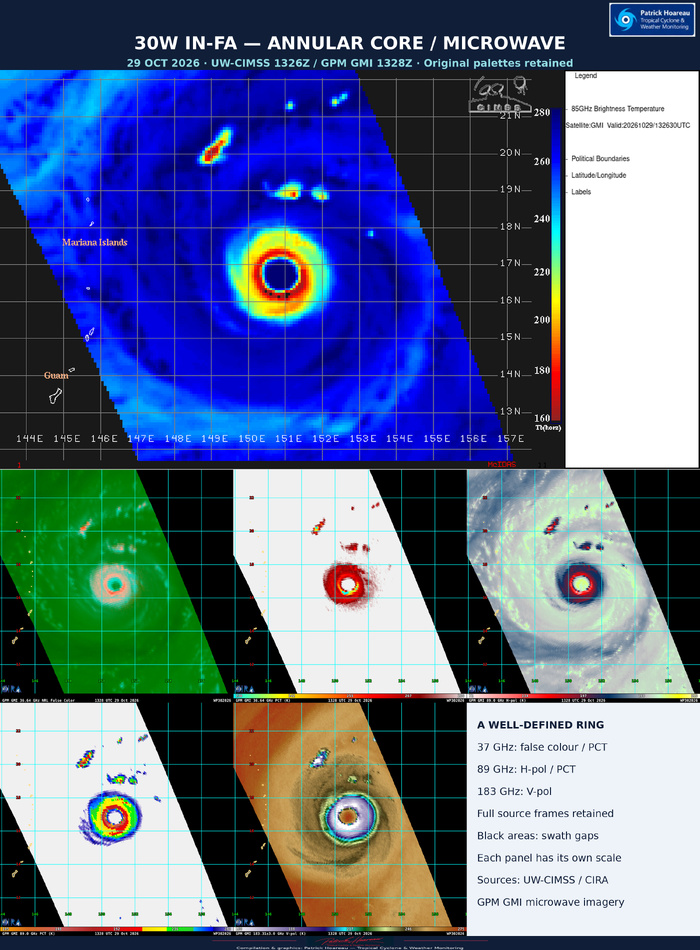
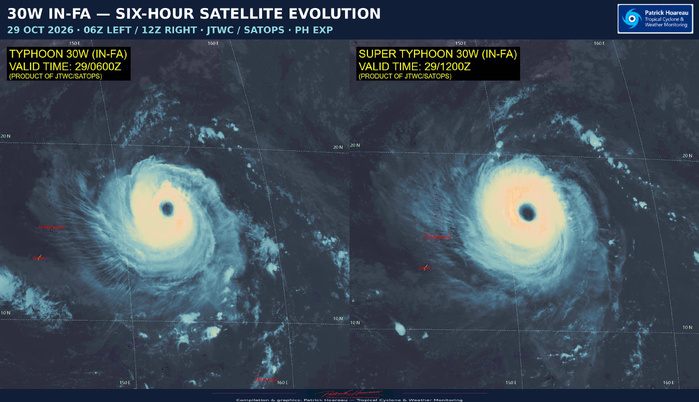
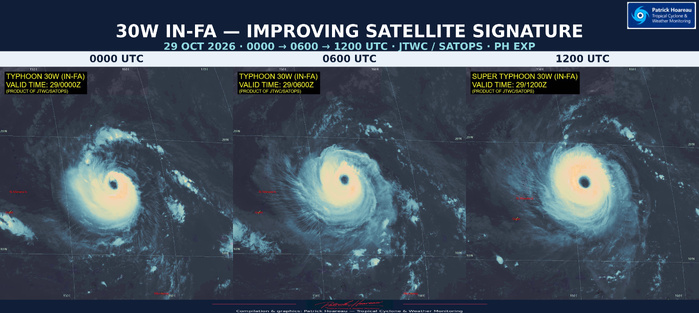
The satellite sequence from 00Z through 06Z to 12Z shows a clear improvement in organisation. The JTWC reports continued cooling of the surrounding cloud tops while the approximately 74 km-wide eye warmed from +17°C to +21.8°C in six hours. Those temperatures come from the official analysis. The increasingly uniform convective ring and the microwave structure support an annular-type appearance: a thick ring surrounds the eye, with limited distinct banding outside it.
The 1013Z Metop-B microwave pass supported this structural assessment. Earlier, the 0755Z Sentinel-1C SAR retrieval measured a maximum of approximately 117 kt, described as near 120 kt in the JTWC reasoning. Satellite organisation continued to improve after that pass. The official 130 kt analysis is also close to the 129 kt D-MINT and D-PRINT estimates cited in the warning discussion. JTWC confidence is high in the position and analysed wind radii, and medium in the intensity.
LATEST FIX: A FULL DVORAK NUMBER IN JUST THREE HOURS
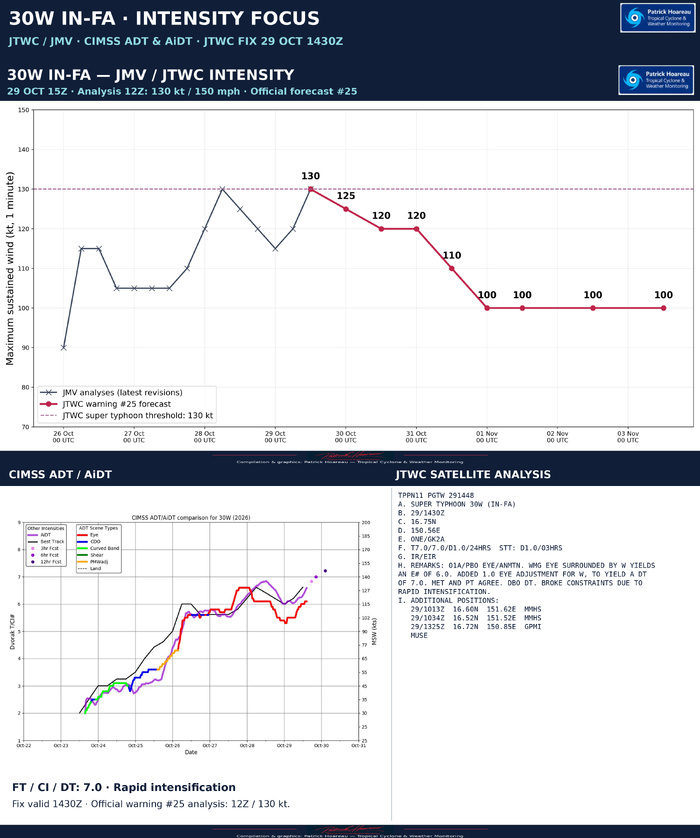
The subsequent JTWC satellite bulletin, valid at 1430Z, gives T7.0/CI7.0, with development of +1.0 over both the preceding three hours and 24 hours. The remarks explicitly state that constraints were broken because of rapid intensification. The eye pattern yields a DT of 7.0, with both MET and PT agreeing; the final estimate is based on DT.
This is a particularly strong short-term development signal, consistent with the improving core seen in our satellite comparison. It is a later satellite assessment than the warning's 12Z initial analysis. The official warning intensity remains 130 kt in this update; the T7.0 fix is presented separately rather than converted into a new warning intensity.
NORTHERN MARIANA ISLANDS: THE IMMEDIATE TRACK FOCUS
The subtropical ridge to the northeast should continue steering IN-FA west-northwestward through roughly +36 hours. The official +24-hour position is 19.3°N, 145.0°E at 30 October 12Z, placing the forecast passage in the northern Mariana Islands region. The centre line identifies the predicted track; damaging winds and other effects extend beyond it.
A TROUGH, TWO RIDGES AND A WESTWARD DEFLECTION
A broad trough passing over Honshu should open a weakness in the subtropical ridge, allowing the typhoon to turn poleward and slow. As that trough moves away, a separate ridge to the west is forecast to build eastward and close the opening, deflecting IN-FA westward. Another trough may create a fresh opening near the end of the five-day forecast, allowing a second poleward turn.
The timing of these competing influences is crucial. A slower-moving first trough, or a slower closure of the ridge weakness, could allow a temporary northeastward track before the westward deflection. Later, a weaker second trough or a stronger western ridge could prolong the westward motion and delay the second poleward turn by 24–48 hours or more. Uncertainty becomes substantial beyond +36 hours.
AI AND CONVENTIONAL MODELS: A DISTINCT SPLIT
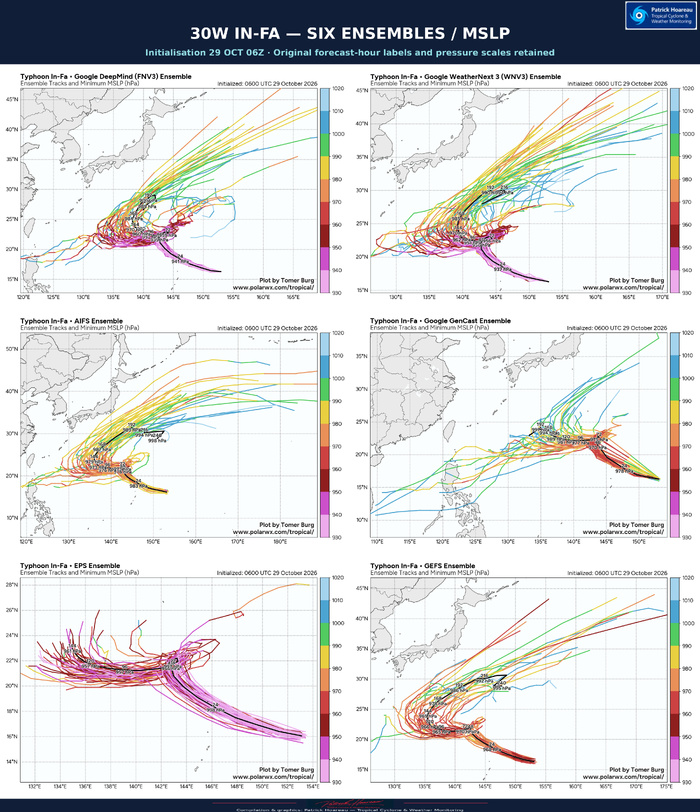
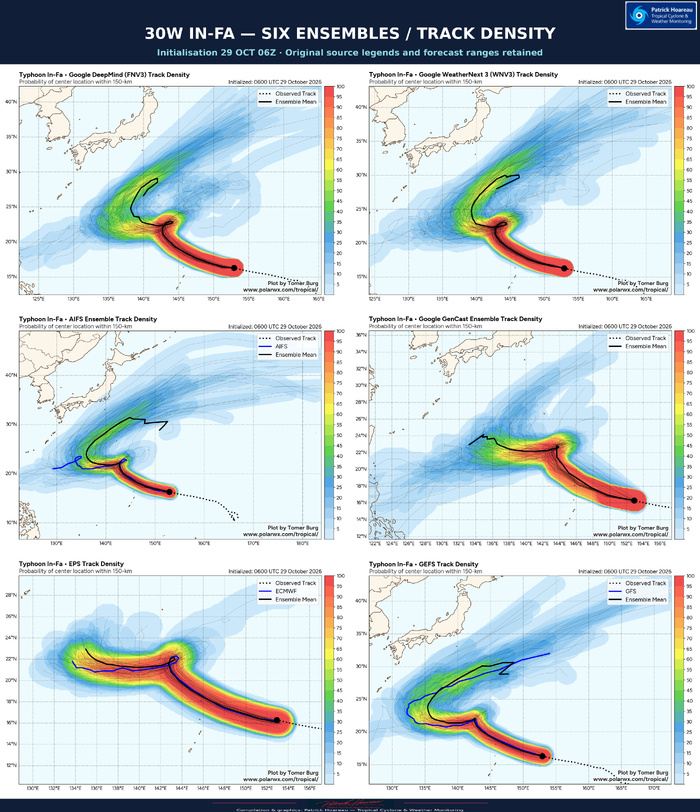
JTWC reports excellent track agreement through +24 hours, with cross-track spread of approximately 93 km. Beyond that, most physics-based models favour an abrupt westward turn and a longer westward leg. The AI guidance generally carries the system northeastward for 12–24 hours before turning it west, at a higher latitude, and brings the second poleward turn earlier.
The official forecast lies near the conventional multimodel consensus through +24 hours, then gradually leans towards the AI-model mean through +72 hours. Farther out, it remains between the AI consensus to the north and the conventional consensus to the south. Our accompanying model comparisons make this separation easier to follow.
INTENSITY: SHORT-TERM POTENTIAL, THEN GRADUAL WEAKENING
Some additional strengthening remains possible during the next 6–12 hours while shear is low and ocean heat content remains high. The environment currently includes sea-surface temperatures of 29–30°C, vertical shear of 10–15 kt and moderate radial outflow. The official forecast nevertheless begins a gradual decline, with 125 kt at +12 hours, 120 kt at +24 and +36 hours, 110 kt at +48 hours, and 100 kt from +60 through +120 hours.
Lower ocean heat content along part of the track should favour slow weakening. Later, slower motion near the westward turn could increase upwelling, while a brief rise in mid-level shear to 20–30 kt around +48 to +60 hours would add stress. Shear should then ease, with sufficient ocean heat content to support a powerful typhoon along the official track.
The later intensity range remains wide. HAFS-A rebuilds the system to 135 kt by +120 hours; Google DeepMind weakens it after +72 hours as its track enters the westerlies earlier, while the faster-recurving COAMPS-TC solution falls to 75 kt. JTWC maintains 100 kt near the centre of the guidance envelope. The track, ocean response and evolution of the core will determine which scenario is closest to reality.
JTWC confidence is medium for both track and intensity through +72 hours, and low from +72 to +120 hours. Warnings are issued every six hours, with satellite analysis bulletins every three hours.
ABOUT THIS GRAPHIC
PL1 pairs our PH forecast map, plotted from the exact warning #25 coordinates, with the full 12Z satellite image processed using our PH EXP enhancement. Forecast markers use US category colours, with a large intensity key below the map. The later 1430Z satellite fix is discussed above; it does not replace the 12Z warning analysis on the map.
Cheers, Patrick Hoareau.
Tropical Cyclone & Weather Monitoring.

SUPER TYPHOON 30W (IN-FA) — INTENSITY FOCUS
2026 OCT 29 | Warning #25: 15Z / analysis 12Z | Satellite fix: 1430Z
A FULL DVORAK NUMBER IN THREE HOURS: +1.0 / 3 H.
The JTWC satellite analysis valid at 1430Z assigns FT 7.0 and CI 7.0, with a development trend of +1.0 over the preceding three hours and +1.0 over 24 hours. The analyst explicitly broke Dvorak constraints because of rapid intensification. The short-term +1.0 is a change in Dvorak number, not a separately measured increase in wind speed.
The eye-pattern calculation uses a warm medium-grey eye surrounded by white, yielding an eye number of 6.0. An eye adjustment of +1.0 produces DT 7.0; MET and PT agree, and the analysis is based on DT. This represents a marked strengthening of the satellite signature since the earlier fixes.
The JMV/JTWC intensity panel retains the revised operational history and the official warning #25 forecast. The latest JMV analyses show 115 kt at 00Z, 120 kt at 06Z and 130 kt (150 mph) at 12Z on 29 October. The official forecast is 125 kt at +12 hours, 120 kt at +24/+36 hours, 110 kt at +48 hours and 100 kt from +60 through +120 hours.
The 1430Z satellite fix is later than the official 12Z analysis. Its FT/CI/DT 7.0 is displayed separately rather than inserted as a new official wind observation into the JMV curve. The accompanying CIMSS ADT/AiDT plot also shows renewed strengthening; its forward dots are automated forecasts, distinct from the observed estimates.
The latest JTWC reasoning allows a little additional strengthening over the next 6–12 hours while shear remains low and ocean heat content remains high. Thereafter, lower heat content, slowing motion with possible cool-water upwelling, and a temporary increase in mid-level shear favour weakening. Both the later intensity and its timing remain closely tied to the uncertain track and structural evolution.
The three-image PH EXP sequence at 00Z, 06Z and 12Z illustrates the improving symmetry and continuity of the convective ring. The 1430Z fix provides a subsequent satellite assessment consistent with that strengthening trend.
Cheers, Patrick Hoareau.
Tropical Cyclone & Weather Monitoring.



SUPER TYPHOON 30W (IN-FA) — JTWC / MODEL COMPARISON
2026 OCT 29 1500 UTC | Warning #25 | Forecasts referenced to 1200 UTC
ONE TYPHOON, TWO VERY DIFFERENT LATER TRACK SCENARIOS
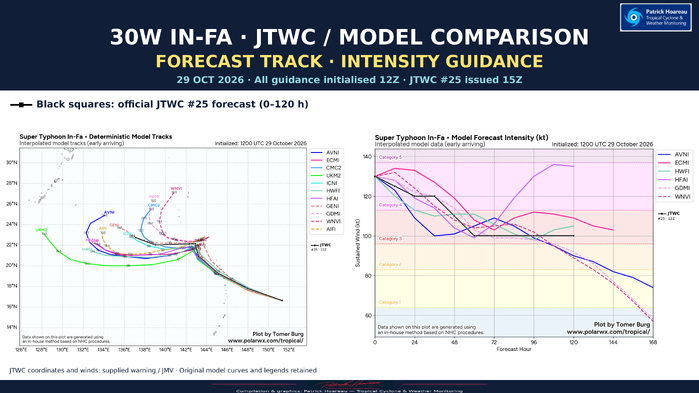
The black line and square markers show the official JTWC forecast, superimposed on the model track and intensity charts. Both panels use a common 12Z forecast reference. The model labels retain their source identifiers; these are interpolated model products, rather than a display of every ensemble member.
TRACK: STRONG EARLY AGREEMENT, THEN A CRITICAL STEERING SPLIT
The guidance is tightly clustered during the initial west-northwestward approach towards the northern Mariana Islands region. JTWC reports a cross-track spread of approximately 93 km at +24 hours. The more difficult part follows: how far poleward IN-FA travels before the ridge rebuilds, when it turns west, and how long that westward leg lasts.
Most conventional models favour an earlier westward deflection and a longer westward track. AI guidance generally allows a temporary northeastward movement before turning the system west at a higher latitude, followed by an earlier second poleward turn. The map shows how strongly these later solutions diverge. Model endpoints also extend to different forecast hours; their final positions must therefore be compared using the printed lead-time labels.
The official JTWC track follows the conventional multimodel consensus initially, then increasingly leans towards the AI-model mean between +24 and +72 hours. Beyond that, it remains between the AI consensus to the north and the conventional consensus to the south. This is a forecast compromise reflecting uncertainty over the timing and strength of the troughs and competing subtropical ridges.
INTENSITY: THE SAME STARTING POINT DOES NOT MEAN THE SAME OUTCOME
The official forecast begins at 130 kt (150 mph), easing to 125 kt at +12 hours, 120 kt at +24 and +36 hours, 110 kt at +48 hours, then 100 kt from +60 through +120 hours. The black horizontal segment late in the forecast represents maintenance of a powerful category 3 typhoon, rather than continued weakening or renewed intensification.
The model curves separate markedly later on. HAFS-A rebuilds IN-FA to around 135 kt by +120 hours, whereas Google DeepMind weakens it as its track reaches the westerlies earlier. ECMWF and HWRF also retain a substantial typhoon in the later forecast, while other solutions weaken more strongly. The contrast is visible directly against the official 100 kt plateau.
These intensity differences are closely linked to the track. A slower turn can increase ocean cooling beneath the cyclone; an earlier poleward escape brings different shear and upper-level winds. The JTWC places its intensity forecast near the centre of the guidance envelope, with conditions along its chosen track still capable of sustaining a 100 kt system.
READING THE TWO PANELS TOGETHER
The key is not simply which model has the highest wind curve or the northernmost endpoint. The track determines the environment the core encounters. The sharp late divergence is therefore both a steering problem and an intensity problem. JTWC confidence is medium for track and intensity through +72 hours, falling to low from +72 to +120 hours.
The charts extend to +168 hours for some models, while the public JTWC forecast stops at +120 hours. No JTWC line is extrapolated beyond its official five-day range. Source model curves, legends and credits are retained; the added black squares come from the supplied JTWC warning/JMV data.
Cheers, Patrick Hoareau.
Tropical Cyclone & Weather Monitoring.