

🌀 JTWC 2025 BEST TRACKS — 71 TROPICAL CYCLONE TRACKS ACROSS THREE REGIONS
How quickly did the strongest cyclones intensify, how fast did they weaken, and how far did they travel?
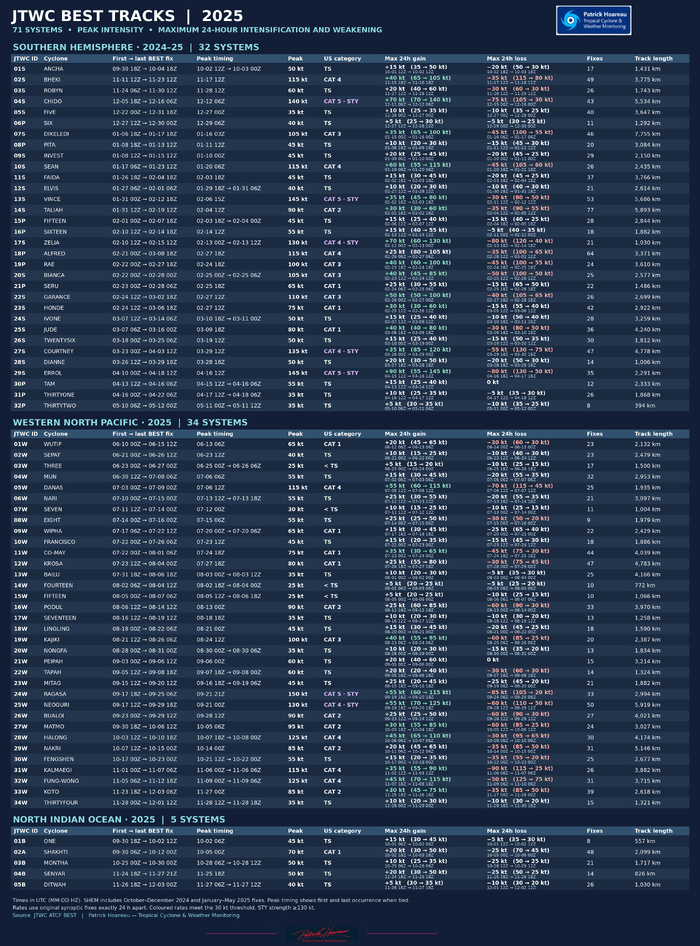
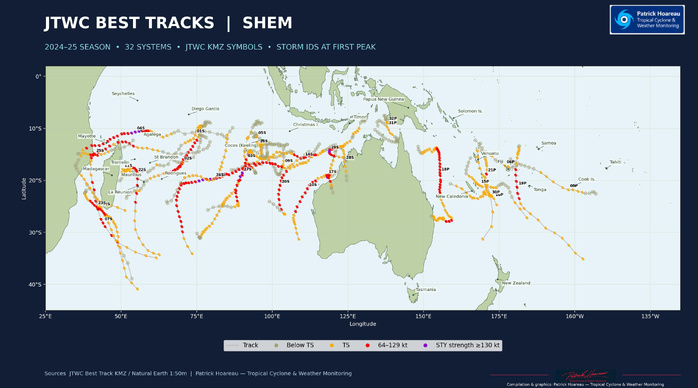
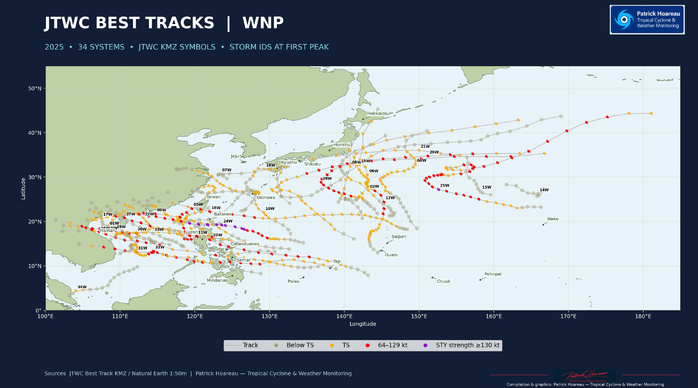
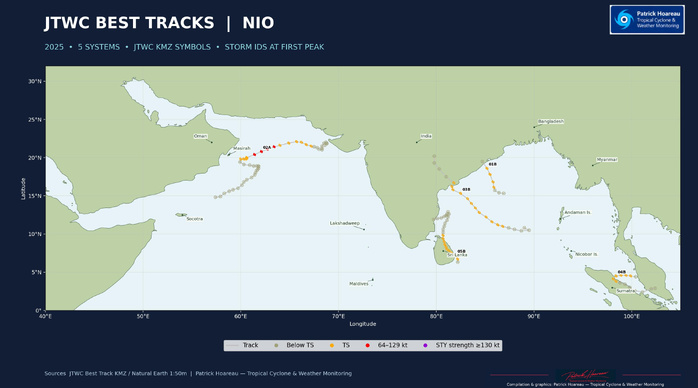
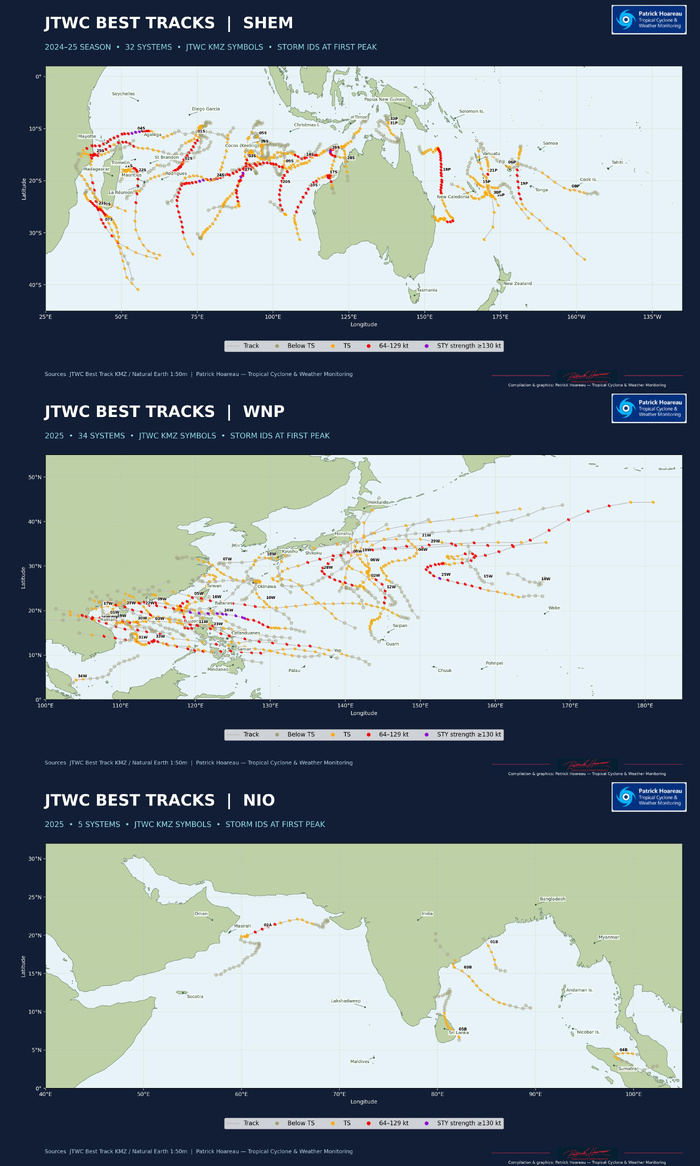
Using the JTWC best tracks, I mapped 71 systems across the Southern Hemisphere (2024–25 season), the Western North Pacific and the North Indian Ocean. The maps use JTWC’s track symbols and colours. The table gives each system’s peak intensity, its largest 24-hour wind gain and loss, and its total track length.
29S ERROL gained 90 kt in 24 hours, from 55 to 145 kt, then lost 80 kt in a later 24-hour window, from 130 to 50 kt. In the Western North Pacific, 31W KALMAEGI dropped from 115 to 25 kt in 24 hours.
The longest tracks in the three archives were 07S DIKELEDI (7,755 km) in the Southern Hemisphere, 25W NEOGURI (5,919 km) in the Western North Pacific and 02A SHAKHTI (2,099 km) in the North Indian Ocean. The shortest tracks were 32P THIRTYTWO (394 km) in the Southern Hemisphere, 14W FOURTEEN (772 km) in the Western North Pacific and 01B ONE (557 km) in the North Indian Ocean. These distances add up the segments between consecutive JTWC best-track positions.
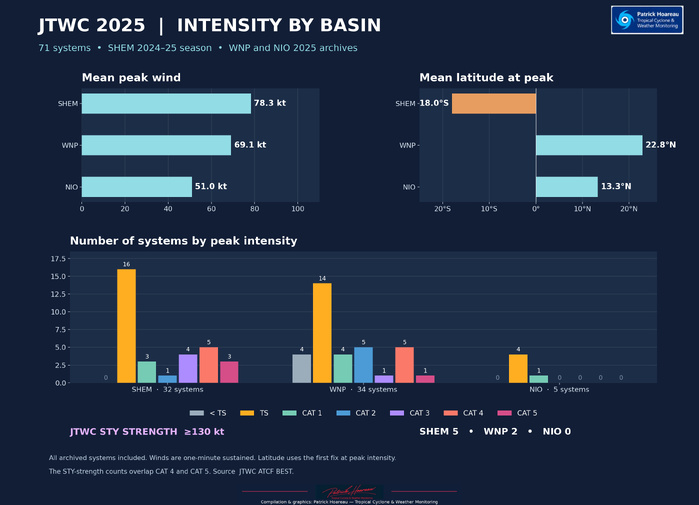
The Southern Hemisphere had the highest mean peak wind in these archives, at 78.3 kt, ahead of the Western North Pacific (69.1 kt) and North Indian Ocean (51.0 kt). The mean latitude at first peak was 18.0°S, 22.8°N and 13.3°N, respectively. Five Southern Hemisphere systems and two Western North Pacific systems reached 130 kt. The intensity charts show the full breakdown by category.
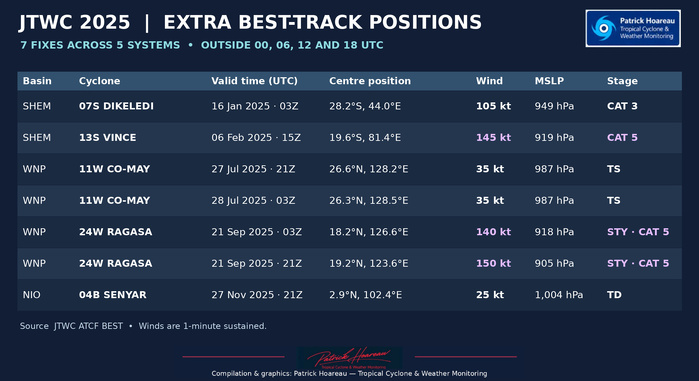
Seven of the 1,933 best-track positions fall outside the standard six-hourly times. They belong to DIKELEDI, VINCE, CO-MAY, RAGASA and SENYAR and are listed on a separate plate.
Patrick Hoareau — Tropical Cyclone & Weather Monitoring
How quickly did the strongest cyclones intensify, how fast did they weaken, and how far did they travel?
Using the JTWC best tracks, I mapped 71 systems across the Southern Hemisphere (2024–25 season), the Western North Pacific and the North Indian Ocean. The maps use JTWC’s track symbols and colours. The table gives each system’s peak intensity, its largest 24-hour wind gain and loss, and its total track length.
29S ERROL gained 90 kt in 24 hours, from 55 to 145 kt, then lost 80 kt in a later 24-hour window, from 130 to 50 kt. In the Western North Pacific, 31W KALMAEGI dropped from 115 to 25 kt in 24 hours.
The longest tracks in the three archives were 07S DIKELEDI (7,755 km) in the Southern Hemisphere, 25W NEOGURI (5,919 km) in the Western North Pacific and 02A SHAKHTI (2,099 km) in the North Indian Ocean. The shortest tracks were 32P THIRTYTWO (394 km) in the Southern Hemisphere, 14W FOURTEEN (772 km) in the Western North Pacific and 01B ONE (557 km) in the North Indian Ocean. These distances add up the segments between consecutive JTWC best-track positions.
The Southern Hemisphere had the highest mean peak wind in these archives, at 78.3 kt, ahead of the Western North Pacific (69.1 kt) and North Indian Ocean (51.0 kt). The mean latitude at first peak was 18.0°S, 22.8°N and 13.3°N, respectively. Five Southern Hemisphere systems and two Western North Pacific systems reached 130 kt. The intensity charts show the full breakdown by category.
Seven of the 1,933 best-track positions fall outside the standard six-hourly times. They belong to DIKELEDI, VINCE, CO-MAY, RAGASA and SENYAR and are listed on a separate plate.
Patrick Hoareau — Tropical Cyclone & Weather Monitoring