

CLICK ON THE MAPS BELOW TO GET THEM ENLARGED

JTWC PH
JTWC FACEBOOK
Joint Typhoon Warning Center
National Hurricane Center
NOVEMBER IN THE WESTERN NORTH PACIFIC — A JTWC CLIMATOLOGICAL PERSPECTIVE
1981–2024 | 44 YEARS
Where do November systems develop, reach their peak and end their tropical phase?
Our new graphics trace 115 systems in the JTWC best-track record, using only JTWC data preserved in NOAA IBTrACS. Selection is based on the first JTWC point at 25 kt occurring in November, rather than the independently verified date of the first operational warning.
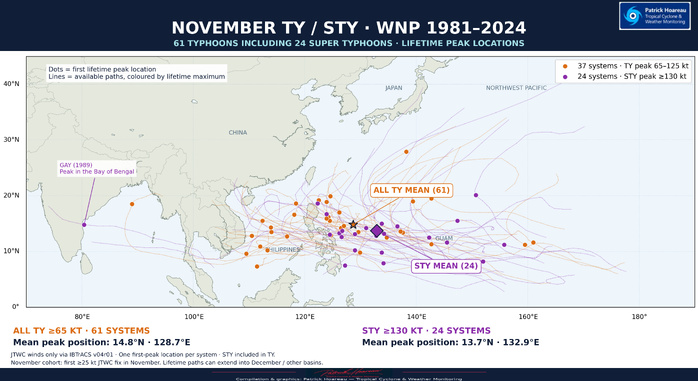
Among these systems, 61 reached typhoon intensity of at least 65 kt, including 24 super typhoons at 130 kt or more. That represents averages of 2.61 systems, 1.39 typhoons and 0.55 super typhoons per November. A system's lifetime peak may occur in December.
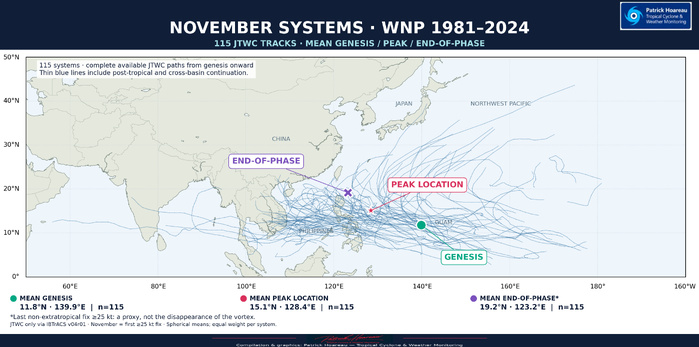
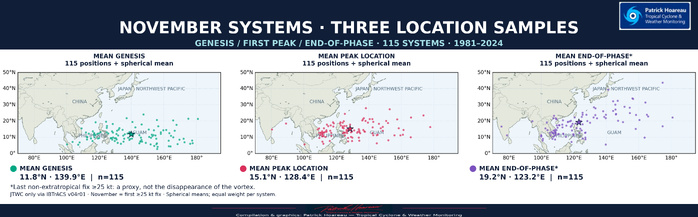
The first map shows the tracks and three mean positions. The second separates the individual genesis, first-peak and end-of-phase locations. Our additional TY/STY map highlights where the stronger systems reached their lifetime maximum: orange marks the 37 typhoons that stayed below super typhoon strength; purple identifies the 24 super typhoons. Their paths are coloured by lifetime peak, not by intensity at every point along the track.
The tracks show a predominantly westward or west-northwestward pattern, often with only a limited gain in latitude. The Philippines lie at the heart of this November track corridor. Tracks towards Taiwan, China and the Japanese islands are less represented, although some systems still curve northward towards these regions. This geographical pattern is not a calculated probability of impact, and a cyclone’s effects can extend well beyond its centre track.
The mean genesis location for all 115 systems is 11.8N, 139.9E; the mean first-peak position is 15.1N, 128.4E. These averages describe this historical sample, rather than a forecast route or the most likely location of a future cyclone. Each system receives equal weight.
For the end-of-phase map, we use the last non-extratropical fix at or above 25 kt as a consistent reference. It is a proxy, not a confirmed location where the vortex completely disappears. Cross-basin continuations are retained, including GAY (1989), which reached its peak in the Bay of Bengal.
We have also specifically examined how this November sample is distributed between El Niño, La Niña and neutral conditions, comparing system, typhoon and super typhoon frequencies as well as their tracks. The additional ENSO comparison graphic appears at the bottom of this article, accompanied by a dedicated explanation in English. The historical classification uses the October–November–December season, centred on November.
Click on each graphic to explore the tracks and geographical distributions in more detail.
Cheers,
Patrick Hoareau
Tropical Cyclone & Weather Monitoring
JTWC FACEBOOK
Joint Typhoon Warning Center
National Hurricane Center
NOVEMBER IN THE WESTERN NORTH PACIFIC — A JTWC CLIMATOLOGICAL PERSPECTIVE
1981–2024 | 44 YEARS
Where do November systems develop, reach their peak and end their tropical phase?
Our new graphics trace 115 systems in the JTWC best-track record, using only JTWC data preserved in NOAA IBTrACS. Selection is based on the first JTWC point at 25 kt occurring in November, rather than the independently verified date of the first operational warning.
Among these systems, 61 reached typhoon intensity of at least 65 kt, including 24 super typhoons at 130 kt or more. That represents averages of 2.61 systems, 1.39 typhoons and 0.55 super typhoons per November. A system's lifetime peak may occur in December.
The first map shows the tracks and three mean positions. The second separates the individual genesis, first-peak and end-of-phase locations. Our additional TY/STY map highlights where the stronger systems reached their lifetime maximum: orange marks the 37 typhoons that stayed below super typhoon strength; purple identifies the 24 super typhoons. Their paths are coloured by lifetime peak, not by intensity at every point along the track.
The tracks show a predominantly westward or west-northwestward pattern, often with only a limited gain in latitude. The Philippines lie at the heart of this November track corridor. Tracks towards Taiwan, China and the Japanese islands are less represented, although some systems still curve northward towards these regions. This geographical pattern is not a calculated probability of impact, and a cyclone’s effects can extend well beyond its centre track.
The mean genesis location for all 115 systems is 11.8N, 139.9E; the mean first-peak position is 15.1N, 128.4E. These averages describe this historical sample, rather than a forecast route or the most likely location of a future cyclone. Each system receives equal weight.
For the end-of-phase map, we use the last non-extratropical fix at or above 25 kt as a consistent reference. It is a proxy, not a confirmed location where the vortex completely disappears. Cross-basin continuations are retained, including GAY (1989), which reached its peak in the Bay of Bengal.
We have also specifically examined how this November sample is distributed between El Niño, La Niña and neutral conditions, comparing system, typhoon and super typhoon frequencies as well as their tracks. The additional ENSO comparison graphic appears at the bottom of this article, accompanied by a dedicated explanation in English. The historical classification uses the October–November–December season, centred on November.
Click on each graphic to explore the tracks and geographical distributions in more detail.
Cheers,
Patrick Hoareau
Tropical Cyclone & Weather Monitoring



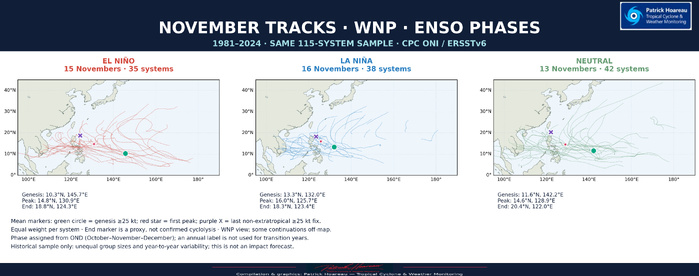
NOVEMBER IN THE WESTERN NORTH PACIFIC: EL NIÑO, LA NIÑA OR NEUTRAL?
1981–2024 — 44 NOVEMBERS
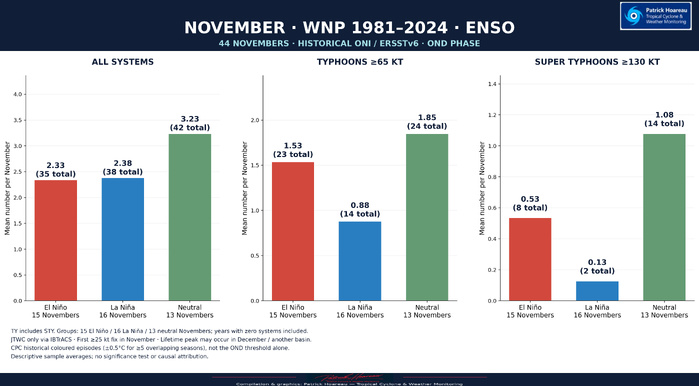
Following your requests, we have divided our 115-system sample by ENSO phase. We use the October–November–December season (OND), centred on November, in NOAA/CPC’s historical ONI/ERSSTv6 classification. This avoids assigning a single label to an entire transition year.
MEAN COUNTS PER NOVEMBER
El Niño — 15 Novembers: 2.33 systems; 1.53 typhoons; 0.53 super typhoons.
La Niña — 16 Novembers: 2.38 systems; 0.88 typhoons; 0.13 super typhoons.
Neutral — 13 Novembers: 3.23 systems; 1.85 typhoons; 1.08 super typhoons.
Super typhoons are included within the typhoon totals. Thresholds are 65 kt for TY and 130 kt for STY, using JTWC one-minute winds. Each average uses the number of Novembers in its own phase, including years with zero systems.
Within this sample, neutral Novembers have the highest mean counts of systems and super typhoons. The mean STY count is much lower in the La Niña group. These are descriptive results for this 44-year period, not proof of causation or statistical significance, and not a forecast for any particular November.
The maps also compare tracks and mean genesis, first-peak and end-of-phase positions. The latter remains the last non-extratropical fix at or above 25 kt, rather than confirmed cyclolysis. Group sample sizes should be kept in view when comparing the geographical patterns.
METHOD AND CHECKS
Cyclone data remain exclusively JTWC records preserved in IBTrACS. November selection uses the first best-track fix at or above 25 kt; the exact first operational warning date has not been independently verified for all month-boundary cases. Peak intensity is taken over the full lifetime.
ENSO phases follow the coloured historical CPC episodes, including persistence for at least five overlapping seasons, rather than the OND threshold alone. Historical ONI is used here for climatological comparison; CPC now uses RONI for operational ENSO monitoring.
Index version matters: November 2016 is neutral in ERSSTv6 but La Niña in ERSSTv5. The v5 check yields 15 El Niño, 17 La Niña and 12 neutral Novembers. The main descriptive conclusions remain unchanged. Both calculations and the year-by-year assignments are included.
Cheers,
Patrick Hoareau
Tropical Cyclone & Weather Monitoring
1981–2024 — 44 NOVEMBERS
Following your requests, we have divided our 115-system sample by ENSO phase. We use the October–November–December season (OND), centred on November, in NOAA/CPC’s historical ONI/ERSSTv6 classification. This avoids assigning a single label to an entire transition year.
MEAN COUNTS PER NOVEMBER
El Niño — 15 Novembers: 2.33 systems; 1.53 typhoons; 0.53 super typhoons.
La Niña — 16 Novembers: 2.38 systems; 0.88 typhoons; 0.13 super typhoons.
Neutral — 13 Novembers: 3.23 systems; 1.85 typhoons; 1.08 super typhoons.
Super typhoons are included within the typhoon totals. Thresholds are 65 kt for TY and 130 kt for STY, using JTWC one-minute winds. Each average uses the number of Novembers in its own phase, including years with zero systems.
Within this sample, neutral Novembers have the highest mean counts of systems and super typhoons. The mean STY count is much lower in the La Niña group. These are descriptive results for this 44-year period, not proof of causation or statistical significance, and not a forecast for any particular November.
The maps also compare tracks and mean genesis, first-peak and end-of-phase positions. The latter remains the last non-extratropical fix at or above 25 kt, rather than confirmed cyclolysis. Group sample sizes should be kept in view when comparing the geographical patterns.
METHOD AND CHECKS
Cyclone data remain exclusively JTWC records preserved in IBTrACS. November selection uses the first best-track fix at or above 25 kt; the exact first operational warning date has not been independently verified for all month-boundary cases. Peak intensity is taken over the full lifetime.
ENSO phases follow the coloured historical CPC episodes, including persistence for at least five overlapping seasons, rather than the OND threshold alone. Historical ONI is used here for climatological comparison; CPC now uses RONI for operational ENSO monitoring.
Index version matters: November 2016 is neutral in ERSSTv6 but La Niña in ERSSTv5. The v5 check yields 15 El Niño, 17 La Niña and 12 neutral Novembers. The main descriptive conclusions remain unchanged. Both calculations and the year-by-year assignments are included.
Cheers,
Patrick Hoareau
Tropical Cyclone & Weather Monitoring


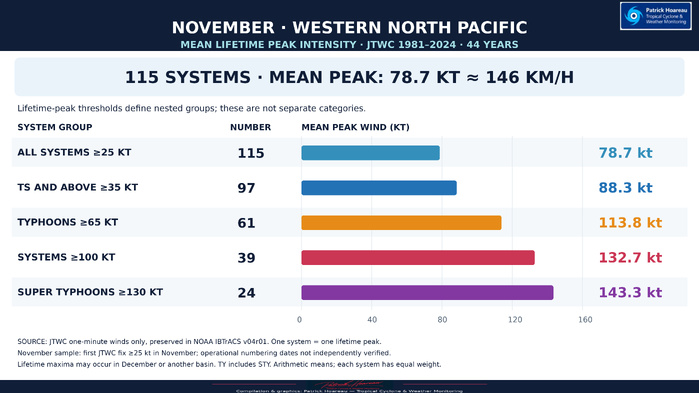
NOVEMBER IN THE WESTERN NORTH PACIFIC — MEAN LIFETIME PEAK INTENSITY
JTWC 1981–2024 | 44 years
Across our 115-system November cohort, the mean lifetime peak intensity is 78.7 kt (approximately 146 km/h). Among the 97 systems reaching at least tropical storm strength (35 kt), the mean is 88.3 kt. The 61 typhoons, including super typhoons, average 113.8 kt; the 39 systems reaching at least 100 kt average 132.7 kt; and the 24 super typhoons average 143.3 kt.
These are nested groups selected by lifetime peak, not mutually exclusive categories. Each system contributes one peak and receives equal weight. The main figure is the arithmetic mean of individual lifetime maxima, not the maximum intensity of an average cyclone or an average of annual means.
The sample is selected by the first JTWC best-track fix at or above 25 kt falling in November during 1981–2024. The operational numbering month has not been independently verified. Peaks can occur in December or after a basin crossing. Winds are JTWC one-minute estimates only, preserved in NOAA IBTrACS v04r01.
JTWC 1981–2024 | 44 years
Across our 115-system November cohort, the mean lifetime peak intensity is 78.7 kt (approximately 146 km/h). Among the 97 systems reaching at least tropical storm strength (35 kt), the mean is 88.3 kt. The 61 typhoons, including super typhoons, average 113.8 kt; the 39 systems reaching at least 100 kt average 132.7 kt; and the 24 super typhoons average 143.3 kt.
These are nested groups selected by lifetime peak, not mutually exclusive categories. Each system contributes one peak and receives equal weight. The main figure is the arithmetic mean of individual lifetime maxima, not the maximum intensity of an average cyclone or an average of annual means.
The sample is selected by the first JTWC best-track fix at or above 25 kt falling in November during 1981–2024. The operational numbering month has not been independently verified. Peaks can occur in December or after a basin crossing. Winds are JTWC one-minute estimates only, preserved in NOAA IBTrACS v04r01.

NOVEMBER IN THE WESTERN NORTH PACIFIC — FOUR DECADES UNDER THE JTWC LENS
1981–2020 | 40 Novembers | 108 systems
SIMILAR NUMBERS, DIFFERENT INTENSITIES AND GEOGRAPHICAL PATTERNS
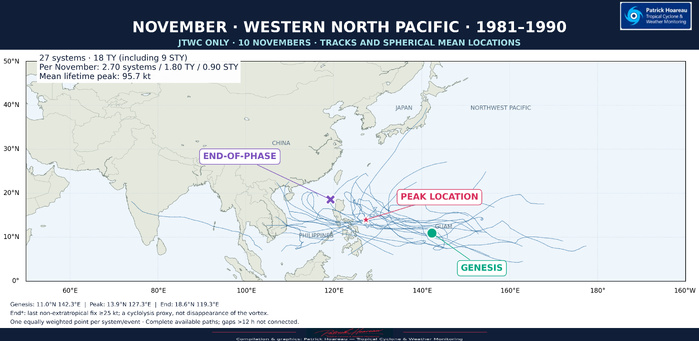
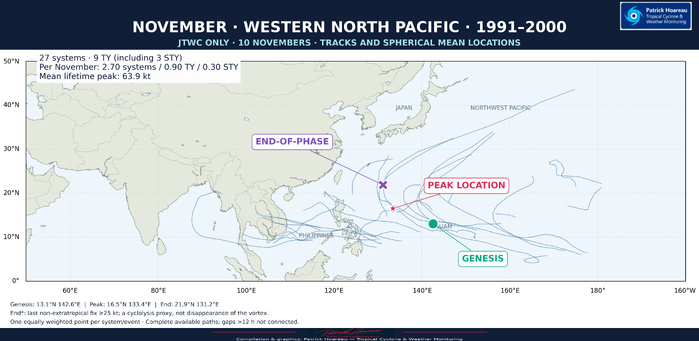
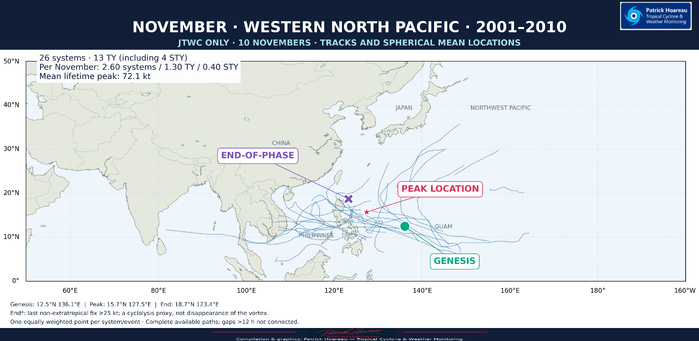
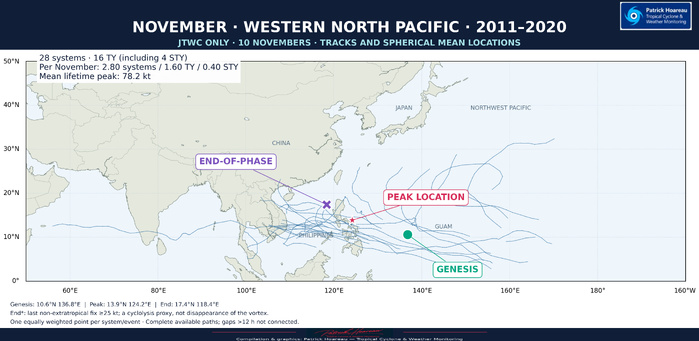
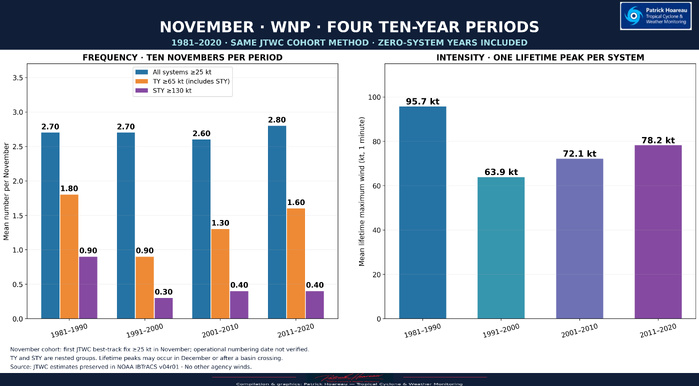
Our November climatological study now includes a comparison of four equal ten-year periods: 1981–1990, 1991–2000, 2001–2010 and 2011–2020. Five PH graphics bring together the mean frequency and lifetime peak intensity, the individual tracks, and the mean locations of genesis, peak intensity and the end of the tropical phase.
👉 EXPLORE THE COMPLETE STUDY — NOVEMBER IN THE WESTERN NORTH PACIFIC, JTWC 1981–2024:
https://www.meteo974.re/NOVEMBER-IN-THE-WESTERN-NORTH-PACIFIC-%E2%80%94-A-JTWC-CLIMATOLOGICAL-PERSPECTIVE-1981-2024--44-YEARS_a2894.html
FREQUENCY CHANGES LITTLE; THE INTENSITY MIX CHANGES MUCH MORE
The four periods contain 27, 27, 26 and 28 systems respectively: an exceptionally narrow range of 2.6–2.8 systems per November. Yet this similar frequency conceals substantial differences in how strong those systems became.
1981–1990: 27 systems, including 18 typhoons and nine super typhoons. Mean frequency: 2.70 systems, 1.80 TY and 0.90 STY per November. The mean lifetime peak reaches 95.7 kt.
1991–2000: 27 systems, including nine typhoons and three super typhoons. Mean frequency: 2.70 systems, 0.90 TY and 0.30 STY per November. The mean lifetime peak falls to 63.9 kt.
2001–2010: 26 systems, including 13 typhoons and four super typhoons. Mean frequency: 2.60 systems, 1.30 TY and 0.40 STY per November. The mean lifetime peak is 72.1 kt.
2011–2020: 28 systems, including 16 typhoons and four super typhoons. Mean frequency: 2.80 systems, 1.60 TY and 0.40 STY per November. The mean lifetime peak is 78.2 kt.
Typhoons are defined here by a lifetime maximum of at least 65 kt, and super typhoons by at least 130 kt, using JTWC one-minute winds. STY are included in the TY totals; these groups must not be added together.
The contrast between the first two periods is particularly striking: the same number of systems, but twice as many typhoons and three times as many super typhoons in 1981–1990. The later periods show a recovery in the proportion reaching typhoon intensity, without returning to the first period's super typhoon frequency. These four blocks do not describe a simple, steadily rising or falling intensity trend.
THE MAPS ADD A DIFFERENT DIMENSION
The four maps use the same geographical scale. Each displays the available tracks and three equally weighted spherical mean locations, with one point per system for each stage.
Mean genesis lies near 142°E in both 1981–1990 and 1991–2000, compared with about 136–137°E in the two later periods — a westward difference of roughly 6° of longitude between these grouped samples.
The 1991–2000 sample stands out for its farther-north and farther-east mean peak and end-of-phase locations. Its mean peak is near 16.5°N, 133.4°E, compared with approximately 13.9°N, 127.3°E in 1981–1990 and 13.9°N, 124.2°E in 2011–2020. The individual tracks reveal the diversity behind those averages; the mean markers are reference locations, not an average cyclone track.
The Philippines remain prominent across the maps, with many trajectories progressing westward or west-northwestward through the tropical Western North Pacific. The decadal differences show why a single basin-wide mean cannot capture the full range of November behaviour.
HOW TO READ THIS COMPARISON
The 40-year comparison is a subset of our complete 44-year study, which extends through 2024. Equal ten-year periods make the frequency comparison straightforward, with zero-system years included. Each lifetime peak receives equal weight; a peak may occur in December or after a basin crossing.
The sample uses the first JTWC best-track point at or above 25 kt in November. This retrospective selection does not independently establish the date of operational numbering. All winds are JTWC estimates preserved in NOAA IBTrACS v04r01; no other agency's winds are used.
For the final mean location, we retain our documented end-of-phase proxy: the last fix at or above 25 kt before excluding extratropical, post-tropical and subtropical statuses. It should not be read as the observed disappearance of the circulation. The maps retain available later track continuation, but do not reconstruct missing positions or join observational gaps exceeding 12 hours.
These are descriptive contrasts between four historical samples. They do not, by themselves, establish a statistically significant trend or its cause. Our complementary ENSO breakdown provides another perspective on November variability.
Full maps, the wider 1981–2024 climatology and complementary analyses are available in the study linked above.
Cheers, Patrick Hoareau.
Tropical Cyclone & Weather Monitoring.
#JTWC #NovemberClimatology #WesternNorthPacific #Typhoon #SuperTyphoon #Philippines
1981–2020 | 40 Novembers | 108 systems
SIMILAR NUMBERS, DIFFERENT INTENSITIES AND GEOGRAPHICAL PATTERNS
Our November climatological study now includes a comparison of four equal ten-year periods: 1981–1990, 1991–2000, 2001–2010 and 2011–2020. Five PH graphics bring together the mean frequency and lifetime peak intensity, the individual tracks, and the mean locations of genesis, peak intensity and the end of the tropical phase.
👉 EXPLORE THE COMPLETE STUDY — NOVEMBER IN THE WESTERN NORTH PACIFIC, JTWC 1981–2024:
https://www.meteo974.re/NOVEMBER-IN-THE-WESTERN-NORTH-PACIFIC-%E2%80%94-A-JTWC-CLIMATOLOGICAL-PERSPECTIVE-1981-2024--44-YEARS_a2894.html
FREQUENCY CHANGES LITTLE; THE INTENSITY MIX CHANGES MUCH MORE
The four periods contain 27, 27, 26 and 28 systems respectively: an exceptionally narrow range of 2.6–2.8 systems per November. Yet this similar frequency conceals substantial differences in how strong those systems became.
1981–1990: 27 systems, including 18 typhoons and nine super typhoons. Mean frequency: 2.70 systems, 1.80 TY and 0.90 STY per November. The mean lifetime peak reaches 95.7 kt.
1991–2000: 27 systems, including nine typhoons and three super typhoons. Mean frequency: 2.70 systems, 0.90 TY and 0.30 STY per November. The mean lifetime peak falls to 63.9 kt.
2001–2010: 26 systems, including 13 typhoons and four super typhoons. Mean frequency: 2.60 systems, 1.30 TY and 0.40 STY per November. The mean lifetime peak is 72.1 kt.
2011–2020: 28 systems, including 16 typhoons and four super typhoons. Mean frequency: 2.80 systems, 1.60 TY and 0.40 STY per November. The mean lifetime peak is 78.2 kt.
Typhoons are defined here by a lifetime maximum of at least 65 kt, and super typhoons by at least 130 kt, using JTWC one-minute winds. STY are included in the TY totals; these groups must not be added together.
The contrast between the first two periods is particularly striking: the same number of systems, but twice as many typhoons and three times as many super typhoons in 1981–1990. The later periods show a recovery in the proportion reaching typhoon intensity, without returning to the first period's super typhoon frequency. These four blocks do not describe a simple, steadily rising or falling intensity trend.
THE MAPS ADD A DIFFERENT DIMENSION
The four maps use the same geographical scale. Each displays the available tracks and three equally weighted spherical mean locations, with one point per system for each stage.
Mean genesis lies near 142°E in both 1981–1990 and 1991–2000, compared with about 136–137°E in the two later periods — a westward difference of roughly 6° of longitude between these grouped samples.
The 1991–2000 sample stands out for its farther-north and farther-east mean peak and end-of-phase locations. Its mean peak is near 16.5°N, 133.4°E, compared with approximately 13.9°N, 127.3°E in 1981–1990 and 13.9°N, 124.2°E in 2011–2020. The individual tracks reveal the diversity behind those averages; the mean markers are reference locations, not an average cyclone track.
The Philippines remain prominent across the maps, with many trajectories progressing westward or west-northwestward through the tropical Western North Pacific. The decadal differences show why a single basin-wide mean cannot capture the full range of November behaviour.
HOW TO READ THIS COMPARISON
The 40-year comparison is a subset of our complete 44-year study, which extends through 2024. Equal ten-year periods make the frequency comparison straightforward, with zero-system years included. Each lifetime peak receives equal weight; a peak may occur in December or after a basin crossing.
The sample uses the first JTWC best-track point at or above 25 kt in November. This retrospective selection does not independently establish the date of operational numbering. All winds are JTWC estimates preserved in NOAA IBTrACS v04r01; no other agency's winds are used.
For the final mean location, we retain our documented end-of-phase proxy: the last fix at or above 25 kt before excluding extratropical, post-tropical and subtropical statuses. It should not be read as the observed disappearance of the circulation. The maps retain available later track continuation, but do not reconstruct missing positions or join observational gaps exceeding 12 hours.
These are descriptive contrasts between four historical samples. They do not, by themselves, establish a statistically significant trend or its cause. Our complementary ENSO breakdown provides another perspective on November variability.
Full maps, the wider 1981–2024 climatology and complementary analyses are available in the study linked above.
Cheers, Patrick Hoareau.
Tropical Cyclone & Weather Monitoring.
#JTWC #NovemberClimatology #WesternNorthPacific #Typhoon #SuperTyphoon #Philippines